DislikedUSDCAD {quote} I see this pattern on every timeframe, What is this ""pattern"" that you see? Big Boss {image} Boss {image} Worker {image}Ignored
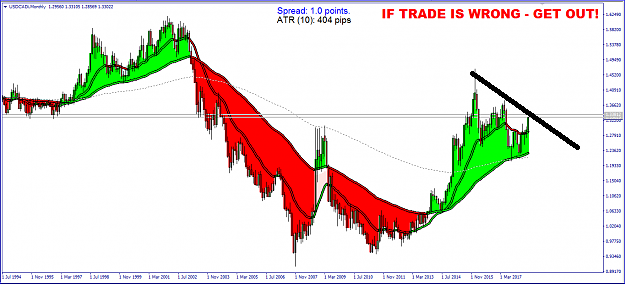
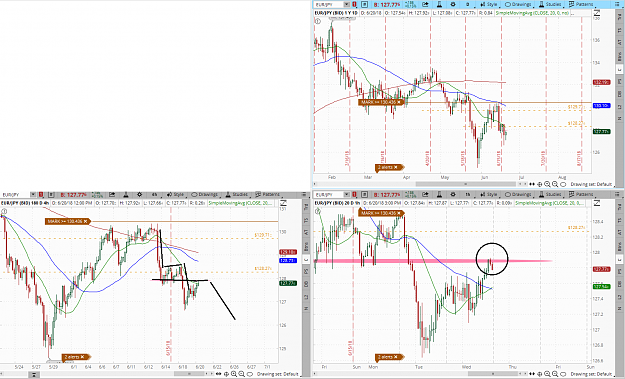
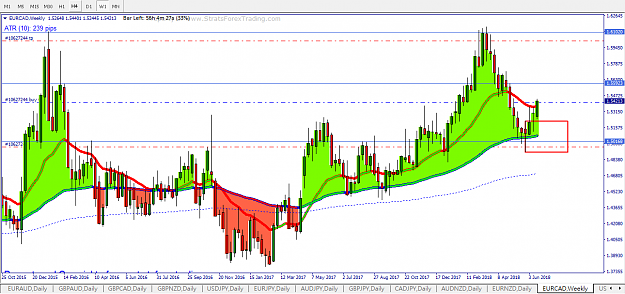
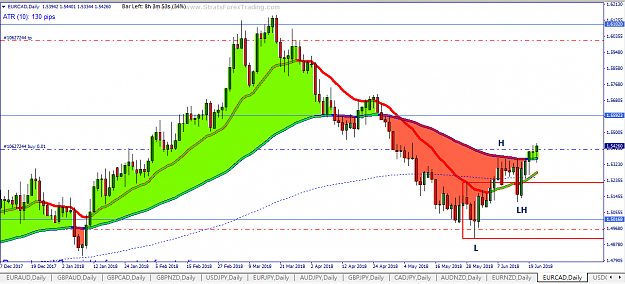
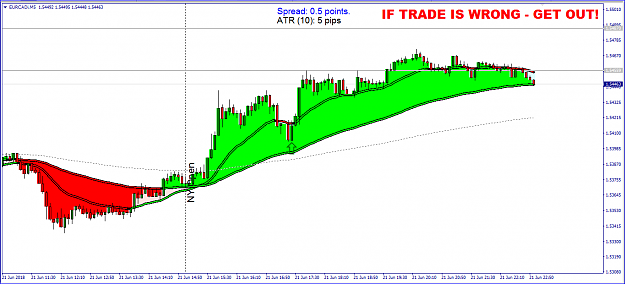
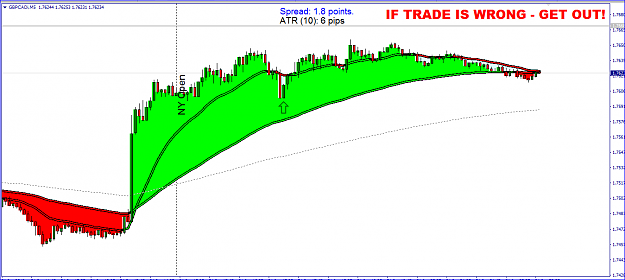
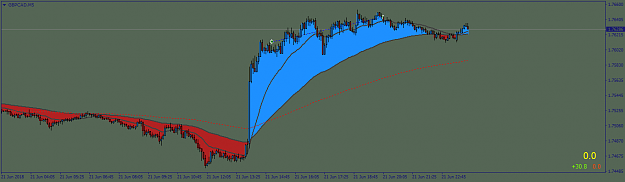
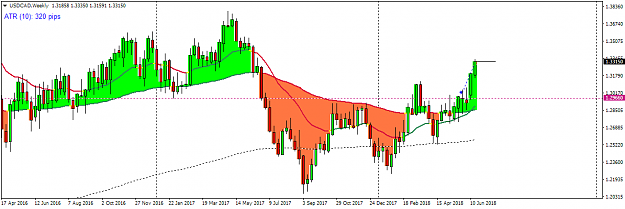
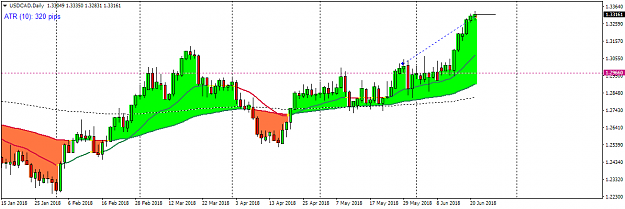
The pattern is the constructive Lower high pattern on the monthly. (I drew it with a black line) As you have shown on th Boss chart. There is some resistance at the 1.3380 level. And the worker looks really extended. I am thinking about waiting for a pullback to the strat shadow on the worker as the boss chart is beginning to show signs of a trend change with higher highs and high lows.
However if I look at the mess that price has to go through, I dont think this is even tradeable. Profit targe of the high of the shooting star on the Big boss seems outlandish.
Man, I am getting so confused. Past charts make so much sense but realtime....that is something I need to work on mentally.
Attached Image