• Home
  • Forums
  • Trades
  • News
  • Calendar
  • Market
  • Brokers
  • Login
  • Join
  • User/Email: Password:
  • 10:27pm
Menu
  • Forums
  • Trades
  • News
  • Calendar
  • Market
  • Brokers
  • Login
  • Join
  • 10:27pm
Sister Sites
  • Metals Mine
  • Energy EXCH
  • Crypto Craft

Options

Bookmark Thread

First Page First Unread Last Page Last Post

Print Thread

Similar Threads

Difference between buy/sell stops & buy/sell limits 34 replies

Difference between buy limit, sell limit, buy stop, & sell stop? 4 replies

how to change buy to sell, sell to buy for EA 1 reply

the buy/buy or sell/sell currency broker?? 5 replies

I am looking for EA to put Buy Stops, Buy limits, Sell limits, and Sell Stops. I will 0 replies

  • Trading Discussion
  • /
  • Reply to Thread
  • Subscribe
  • 6
Attachments: How to buy/sell the dips in a trend?
Exit Attachments

How to buy/sell the dips in a trend?

  • Last Post
  •  
  • Page 1 2
  • Page 1 2
  •  
  • Post #1
  • Quote
  • First Post: Edited at 3:47am Jun 21, 2018 3:19am | Edited at 3:47am
  •  RaysJourney
  • | Joined Nov 2017 | Status: Member | 178 Posts
I've been trying to find threads regarding my question "How to buy/sell the dips in a trend?" in ForexFactory and other websites, but sadly with no success (at least I was not able to implement it correctly). If anyone has a link to a thread that explains exactly that, please link it, I'd appreciate it.

So, my question is: how do I buy or sell the pullbacks/retracements in a trend?

I've been trading the trend for the past few months now, learning as much as I can and trying to implement everything what I have learned so far.

So far, the most success I had with was as following:

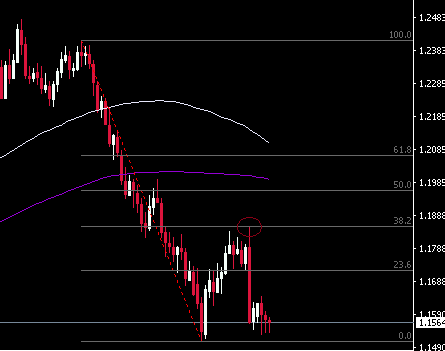
- Retracement back to the 50 EMA
- Stochastics are in overbought/oversold (I don't like it, but I haven't found a way yet to do it without an oscillator)
- Together with a confluence of SR ("normal" SR, round number or pivot).
- Candlestick patterns, mainly engulfing

What I do works fine - it's not very good but something I can build upon. However, I have some issue with it:

- The 50 EMA is often slow, thus, I miss some trade in a strong trending market. I am also not sure how to catch pullbacks that are very small pullbacks which do not retrace back to the 50 EMA.
- Also, which smaller pullbacks in a strong trending market have high probability working out? Which factors could I consider?
- When it trends strongly, and it pulls back slightly, the oscillator often doesn't go into overbought/oversold(depending on the period of course, but I use the standard settings), which for some reason I automatically skip trades and miss a lot of the move. Something I want to improve on which would scream for understanding price action and removing that damn oscillator (lol)
- TP and SL placement if it doesn't pull back deep enough. Also, generally TP and SL when trading the 50 EMA.
- I also do not consider analyzing one time frame higher. Is that necessary? If yes, then what would I be looking for? For me higher TF just means buying/selling the bigger retracement?

Is there anyone trading the dips successfully and is able to share some insights? I've been back and forward testing a lot but not sure why I am stuck at figuring out a better way to buy/sell dips. Most strategies include MA crosses which I am not a big fan of .. or maybe that's the solution? Hmmm ...

Thank you for any contributions!
  • Post #2
  • Quote
  • Jun 21, 2018 3:35am Jun 21, 2018 3:35am
  •  rockit
  • Joined Oct 2013 | Status: Member | 819 Posts
Quoting RaysJourney
Disliked
Is there anyone trading the dips successfully and is able to share some insights?
Ignored
I think that one can (safely) assume that the 1st fibo level will be hit on a retracement..
..
  • Post #3
  • Quote
  • Jun 21, 2018 3:40am Jun 21, 2018 3:40am
  •  RaysJourney
  • | Joined Nov 2017 | Status: Member | 178 Posts
Quoting rockit
Disliked
{quote} I think that one can (safely) assume that the 1st fibo level will be hit on a retracement..
Ignored
Fibonacci hmm .. was never really a big fan using it and never really used it but I could test that. As first level, you mean the 38.2?
  • Post #4
  • Quote
  • Jun 21, 2018 4:10am Jun 21, 2018 4:10am
  •  rockit
  • Joined Oct 2013 | Status: Member | 819 Posts
Quoting RaysJourney
Disliked
{quote} Fibonacci hmm .. was never really a big fan using it and never really used it but I could test that. As first level, you mean the 38.2?
Ignored
On a standard fibo tool the 1st level comes at 23.6. Here's an example of recent E/U chart, where price retraced to exactly the 2nd fibo level (and of course to 1st level prior to that):
Attached Image
..
1
  • Post #5
  • Quote
  • Jun 21, 2018 4:53am Jun 21, 2018 4:53am
  •  RaysJourney
  • | Joined Nov 2017 | Status: Member | 178 Posts
Fibonacci could be one tool, but is there something else I could consider improving or adding?
  • Post #6
  • Quote
  • Jun 21, 2018 5:03am Jun 21, 2018 5:03am
  •  Kxeroo
  • | Joined Apr 2014 | Status: Member | 165 Posts
Hi there Ray,

Obviously you don't have a trading plan. If you are missing trades that means you are trading on short time frames. There is nothing wrong with missing a trade as there is always others to come. You first have to get rid of that thought of catching every pips, dips and tops. If you are a trend trader and have the patience to trade H4 and over then I can suggest you few things:

* Follow the price action on key leves to re-enter or scale in-out. S&R are mainly known static. In order to strengthen this you add up EMA 21 and EMA 8 and those will represent your dynamic S&R. So when you see a nice price action set up in that static and dynamic levels you can re enter. Simple as that.

* If you really want to trade on short time frames then I suggest you to be very careful of news feed because anything lower time frames is speculative and cannot repsent the general sentiment properly.

* Stochastics are meant to be created to spot divergences. Otherwise there is no overbought and oversold level in the market for any time frame. So don't rely on them too much.

There is too much to offer but what fits my trading style may not fits yours so it is something you have to sit down and study charts for hours to see what works for you.

Regards,
1
  • Post #7
  • Quote
  • Jun 21, 2018 5:25am Jun 21, 2018 5:25am
  •  RaysJourney
  • | Joined Nov 2017 | Status: Member | 178 Posts
Quoting Kxeroo
Disliked
Hi there Ray, Obviously you don't have a trading plan. If you are missing trades that means you are trading on short time frames. There is nothing wrong with missing a trade as there is always others to come. You first have to get rid of that thought of catching every pips, dips and tops. If you are a trend trader and have the patience to trade H4 and over then I can suggest you few things: * Follow the price action on key leves to re-enter or scale in-out. S&R are mainly known static. In order to strengthen this you add up EMA 21 and EMA 8 and...
Ignored
Wonderful explanation, thanks Kxeroo. Few questions if you do not mind:

- Why would time frame matter in such cases? For example, I'd have the EMA 8 and 21 on the M15 and follow the exact same trading plan as if it was on the 4H? I'd also pay attention to key levels and PA on lower time frames as well.

- I've quickly backtested a bit by adding the EMA 8 and 21 and it works pretty nicely, at least it gives me visually a good idea of what to expect. I like that!

- Once price pulls back inside the EMA 8 and 21 in a trend, what would you be looking for? Would you go for specific candlestick formations, like pinbar, engulfs, hammers and what not and enter as soon as one forms or?

- Key levels are something like SR, pivots, round numbers, etc? Just making sure I understand what you talk about.

- I was not aware about stochastics just being used for divergence. I'll back and forward test this again to check if it makes a difference for me.

Yes, I am aware that it requires hour of screentime, but your insight already helps a lot getting on the right track!
  • Post #8
  • Quote
  • Jun 21, 2018 6:40am Jun 21, 2018 6:40am
  •  Kxeroo
  • | Joined Apr 2014 | Status: Member | 165 Posts
Quoting RaysJourney
Disliked
{quote} Wonderful explanation, thanks Kxeroo. Few questions if you do not mind: - Why would time frame matter in such cases? For example, I'd have the EMA 8 and 21 on the M15 and follow the exact same trading plan as if it was on the 4H? I'd also pay attention to key levels and PA on lower time frames as well. - I've quickly backtested a bit by adding the EMA 8 and 21 and it works pretty nicely, at least it gives me visually a good idea of what to expect. I like that! - Once price pulls back inside the EMA 8 and 21 in a trend, what would you be...
Ignored
Time frames matters because higher the time frame the more information it contains in a single bar. Visiually it is easier to read sentiment. I am not saying you cannot see in short time frames. But price action set ups are at least two candles that means, on H1 chart two bar represents 2 hrs of information. Trend or general sentiment doesn't change in 2 hrs. It takes time for investors to digest news feed and re-position themselves. Given this fact that still doesn't mean shorter time frame doesn't work but it would have lot of fake moves than longer time frames. The idea of trading for many is to make money and be the boss of their business. If one plan to sit in front of screen all day and night just to get those few pips with high risk that is personal choice.

Comming to my suggestion; dynamic supports are very effective spots to trade. You have to have confluence of several facts in order to open position. Once the price retrace back to dynamic support just look for engulfing, inside bars, pin bars. But make sure you are on a pivot level or any horizontal line as well. Perfect entry needs time to master. Always wait for bars to close before making a decision. Since you are going to trade on H4 and D1(just assuming) you have plenty of time to set your entry and exits. If you look carefullly when there is a price rejection of certain point you can always see a little pull back before it resumes its trend. Saying that never forget we are betting on probabilities and I am just saying this way you are on the higher probability side. But that doesn't mean you will win all trades. So always manage your risk first and money rolls in. Rule number 1 for any successfull trader is PROTECT THE CAPITAL. There is always another day and there is always a better trade.

Info about stochastic: https://www.investopedia.com/terms/s...oscillator.asp

*Oscilators lags, they cannot indicate true overbought and oversold region coz there is nothing like that. When you think it is the dip it goes deeper when you think it is overbought, price can shoot up to the roof. So it has to confluence with price chart. Divergence setups are true price action and price action is the king. I don't want to get in details of setups but you can find a lot of information about divergences.

If you will have any more question feel free to ask. But I have to remind you best way to learn this is to put screen time and read about it. And again, reading is one thing applying on a real platform is different ..

Regards,
2
  • Post #9
  • Quote
  • Jun 21, 2018 7:45am Jun 21, 2018 7:45am
  •  RaysJourney
  • | Joined Nov 2017 | Status: Member | 178 Posts
Quoting Kxeroo
Disliked
{quote} Time frames matters because higher the time frame the more information it contains in a single bar. Visiually it is easier to read sentiment. I am not saying you cannot see in short time frames. But price action set ups are at least two candles that means, on H1 chart two bar represents 2 hrs of information. Trend or general sentiment doesn't change in 2 hrs. It takes time for investors to digest news feed and re-position themselves. Given this fact that still doesn't mean shorter time frame doesn't work but it would have lot of fake moves...
Ignored
Kxeroo, thanks a ton, very helpful insight. I will test this for the next couple weeks and lets see how it goes. Thanks again!
  • Post #10
  • Quote
  • Jun 21, 2018 7:53am Jun 21, 2018 7:53am
  •  MaxenshteinD
  • Joined May 2016 | Status: carpe diem et memento mori | 478 Posts
Personally I have rules :

1. Identify the trend
2. Identify the median of that trend
3. Identify the range around that median where the market is considered to be in a range

I`m sure you heard and seen trending periods, and ranging periods.
The thing is that ranging periods can be diagonal as well!
Each trend has its median, and the range around that median where price will range.

As for the tools ?
Well I found the moving average does the easiest job of identifying the median, however its just a visual tool.

Here are the examples :

In the first example everything is more or less good, there are enough opportunities to get in to the trend with a visual border to hide stops across.
However due to the nature of the markets, trends can be in all kind of degrees (90 degrees being a vertical spike trend) (45 degrees being an average trend) (0 degrees being a whipsaw). The stronger the trend is, the closer it is to 90degrees.

The very same tool which was performing good in the first example, turns to chaos in the second example where the degree is different.
And even leads to allot of missed opportunities in a more vertical trend.

Once could of course adapt the system every time, but wouldn't that be curve fitting ?
Attached Images (click to enlarge)
Click to Enlarge

Name: Screenshot1.png
Size: 25 KB Click to Enlarge

Name: Screenshot2.png
Size: 26 KB Click to Enlarge

Name: Screenshot3.png
Size: 25 KB
The truth is hidden from you
  • Post #11
  • Quote
  • Jun 21, 2018 8:27am Jun 21, 2018 8:27am
  •  RaysJourney
  • | Joined Nov 2017 | Status: Member | 178 Posts
Quoting MaxenshteinD
Disliked
Personally I have rules : 1. Identify the trend 2. Identify the median of that trend 3. Identify the range around that median where the market is considered to be in a range I`m sure you heard and seen trending periods, and ranging periods. The thing is that ranging periods can be diagonal as well! Each trend has its median, and the range around that median where price will range. As for the tools ? Well I found the moving average does the easiest job of identifying the median, however its just a visual tool. Here are the examples : In the first...
Ignored
Thank you for your insight. So we both agree that the medians do their jobs. You seem to use the 50 EMA if I am not mistaken? How are you using it personally and how do you generally trade without leaking your secrets? Except you wish to share it of course, that'd be very helpful as well.

I am basically trying to maximize and improve my current method by adding/removing stuff and paying more attention to something that I perhaps do not pay any attention to at all.

PS: In ranging markets, I often don't trade (or in other words, where the median is just "on" the price) and stay out of the market until a trend establishes again.
  • Post #12
  • Quote
  • Jun 21, 2018 9:39am Jun 21, 2018 9:39am
  •  MaxenshteinD
  • Joined May 2016 | Status: carpe diem et memento mori | 478 Posts
Quoting RaysJourney
Disliked
{quote} Thank you for your insight. So we both agree that the medians do their jobs. You seem to use the 50 EMA if I am not mistaken? How are you using it personally and how do you generally trade without leaking your secrets? Except you wish to share it of course, that'd be very helpful as well. I am basically trying to maximize and improve my current method by adding/removing stuff and paying more attention to something that I perhaps do not pay any attention to at all. PS: In ranging markets, I often don't trade (or in other words, where the...
Ignored
That is a 30 m.a. (sometimes i use a lwma or ema).
The 30 is not random, 5 days * 24 hours = 120 hours. 120 hours / 4 hours = 30 bars.
Simply put I have a rolling media of the weekly.

As for entries provided that the angle of the trend line implies a trend, find micro congestions near it, and trade their breakouts.
The truth is hidden from you
  • Post #13
  • Quote
  • Jun 21, 2018 10:06am Jun 21, 2018 10:06am
  •  RaysJourney
  • | Joined Nov 2017 | Status: Member | 178 Posts
Quoting MaxenshteinD
Disliked
{quote} That is a 30 m.a. (sometimes i use a lwma or ema). The 30 is not random, 5 days * 24 hours = 120 hours. 120 hours / 4 hours = 30 bars. Simply put I have a rolling media of the weekly. As for entries provided that the angle of the trend line implies a trend, find micro congestions near it, and trade their breakouts.
Ignored
Ah right, breakouts. So basically put a trendline on the congestion and trade the breakout? Sounds a bit too simple, but I will test it - after all, Forex should be simple.

Any ways of finding an entry before the breakout? I think the only way is by opening an order on pinbars and what not with other confluences?
  • Post #14
  • Quote
  • Jun 21, 2018 3:39pm Jun 21, 2018 3:39pm
  •  MaxenshteinD
  • Joined May 2016 | Status: carpe diem et memento mori | 478 Posts
Quoting RaysJourney
Disliked
{quote} Ah right, breakouts. So basically put a trendline on the congestion and trade the breakout? Sounds a bit too simple, but I will test it - after all, Forex should be simple. Any ways of finding an entry before the breakout? I think the only way is by opening an order on pinbars and what not with other confluences?
Ignored
Sorry just saw your reply now, what I mean by micro congestion is = 1 bar engulfing more than 2-3 bars.
Imagine a triangle pattern made only out of 5 bars.

Now it is a good idea to plan the entry in advance. Provided that we are in an up trend, and we see a micro congestion of 4 bars near our moving average. Set a buy stop on top of that congestion, and a stop loss below (most like it will be below the moving average). If the breakout does happen. Due to the small size of the micro congestion compared to the Risk : Reward. You might easily get even 1:10 ratio
The truth is hidden from you
  • Post #15
  • Quote
  • Jun 21, 2018 3:46pm Jun 21, 2018 3:46pm
  •  MaxenshteinD
  • Joined May 2016 | Status: carpe diem et memento mori | 478 Posts
The point is :
The micro congestion is a "bifurcation point"
( A point in parameter space where one can expect to see a change in the qualitative behaviour of a system—e.g., loss of stability of a solution or the emergence of a new solution with different properties.).

Meaning that it is a point where our trending phase changed to a state of congestion. Which means that a new trend most likely will be born right from there. The chances of the new trend being a continuation than a reversal is slightly better. But that isn't the point.

The point is that we have identified a possible point of origin for a new trend, which allows us to enter with mininum risk.
In order to see whether the trend happens in our favor or not.
If its in our favor, than even if it reverses we have little to lose.
If it dosent reverse, we have possible huge profit in comparison to our risk. And if it just reverses, than we just take a small loss relative to possible profit
The truth is hidden from you
1
  • Post #16
  • Quote
  • Jun 21, 2018 9:12pm Jun 21, 2018 9:12pm
  •  RaysJourney
  • | Joined Nov 2017 | Status: Member | 178 Posts
Quoting MaxenshteinD
Disliked
The point is : The micro congestion is a "bifurcation point" ( A point in parameter space where one can expect to see a change in the qualitative behaviour of a system—e.g., loss of stability of a solution or the emergence of a new solution with different properties.). Meaning that it is a point where our trending phase changed to a state of congestion. Which means that a new trend most likely will be born right from there. The chances of the new trend being a continuation than a reversal is slightly better. But that isn't the point. The point is...
Ignored
Wonderful explanation, thank you for that.

It seems that there is just so much more to trend trading which I wasn't aware of. Learning from you is great, you seem to have it figured out in your own style.

I will get to work and see if I can use your theory and turn it into practice. And saying that a high RR is possible is tough for me to believe because I do not aim more than for a 1:1 or 1:2 hehe.

Thanks MaxenshteinD!
  • View Post
  • Disliked by Thread Starter
  • Swisse
  • Post #18
  • Quote
  • Jun 21, 2018 10:37pm Jun 21, 2018 10:37pm
  •  yonnie
  • Joined May 2008 | Status: Member | 1,144 Posts
if you want to trade the long-term trend, 15m TF is too small to trade from imo.
when you`re ready to go for 4hr/daily TF, check out the feb2865 thread no 1.
  • Post #19
  • Quote
  • Jun 21, 2018 11:10pm Jun 21, 2018 11:10pm
  •  RaysJourney
  • | Joined Nov 2017 | Status: Member | 178 Posts
Quoting yonnie
Disliked
if you want to trade the long-term trend, 15m TF is too small to trade from imo. when you`re ready to go for 4hr/daily TF, check out the feb2865 thread no 1.
Ignored
Thank you for the recommendation, I will get to reading his thread now :-)

PS: I never mentioned any specific timeframe I trade. The 15M was just an example to compare. I am willing to trade anything from 1M to Daily, so that's fine!
  • Post #20
  • Quote
  • Edited at 2:13am Jun 22, 2018 12:43am | Edited at 2:13am
  •  VEEFX
  • Joined Jun 2006 | Status: Adios! | 3,377 Posts
Quoting yonnie
Disliked
if you want to trade the long-term trend, 15m TF is too small to trade from imo. when you`re ready to go for 4hr/daily TF, check out the feb2865 thread no 1.
Ignored
Hmm.. what does entry timeframe have anything to do with trade duration or trading style? There is absolutely no correlation between the two. I can trade on 1 second chart and hold the trade until friday. In fact, I can scalp or swing or position trade literally 100s of timeframe combinations round the clock. Timeframes, market conditions and trading style has absolutely no dependance....or I should say it has dependance only if you are a visual chartists/trader.

P.S. I have not read the thread. I am responding only to this post and only to yonnie before idiots start their rhetorical attacks :-)
Staying in my lane...
1
  • Trading Discussion
  • /
  • How to buy/sell the dips in a trend?
  • Reply to Thread
    • Page 1 2
    • Page 1 2
1 trader viewing now
  • More
Top of Page
  • Facebook
  • Twitter
About FF
  • Mission
  • Products
  • User Guide
  • Media Kit
  • Blog
  • Contact
FF Products
  • Forums
  • Trades
  • Calendar
  • News
  • Market
  • Brokers
  • Trade Explorer
FF Website
  • Homepage
  • Search
  • Members
  • Report a Bug
Follow FF
  • Facebook
  • Twitter

FF Sister Sites:

  • Metals Mine
  • Energy EXCH
  • Crypto Craft

Forex Factory® is a brand of Fair Economy, Inc.

Terms of Service / ©2021