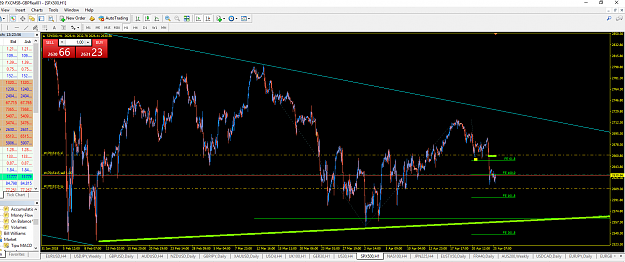
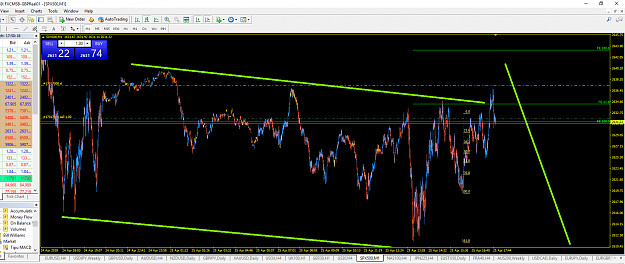
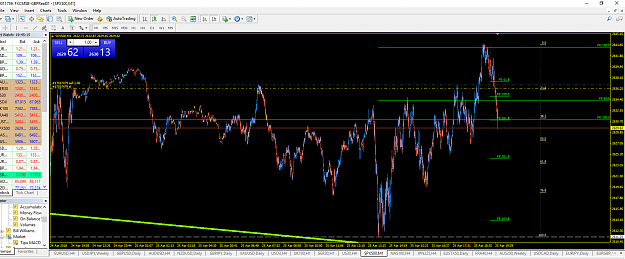
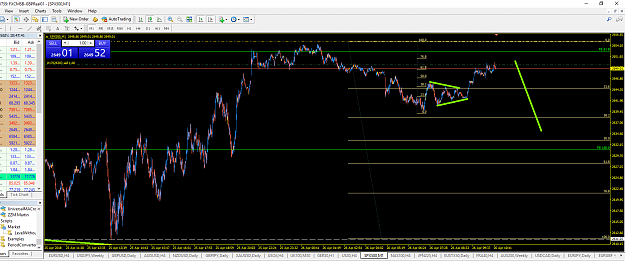
. I am focused a lot on the major Indexes at present and not least SPX.
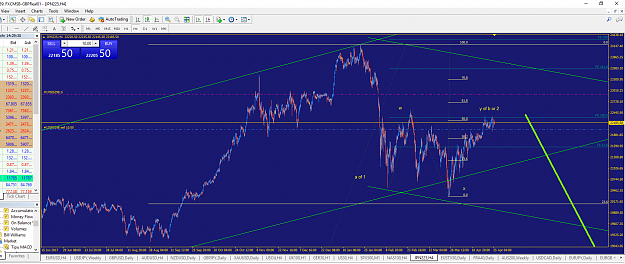
The Triangle in the higher time-frames is noted as something major but I think we need another push down and so I am short with my Stop just above the deemed relevant "Invalidation level"
For me this one is "psychological" because I keep bouncing off the "Highs" on my "Month-To-Date" statement. I will rest here for a moment and breath a little
. I dont know about You guys but I will share my "Diary / Journal" method, because it is effective and simple.
I NEVER account for the "Reasons" or "Logic".
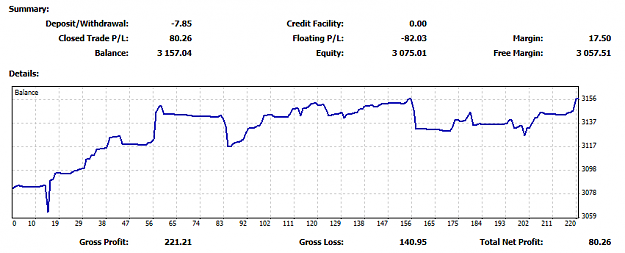
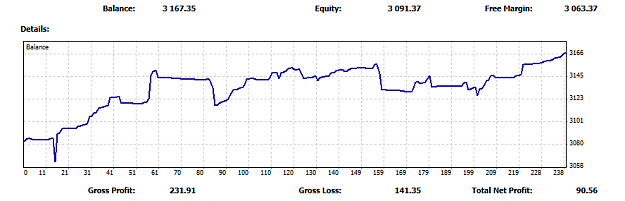
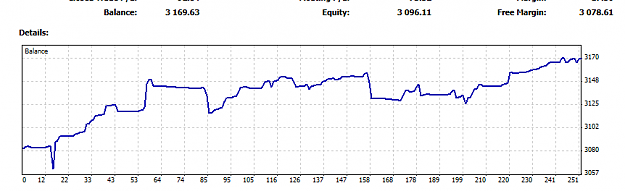
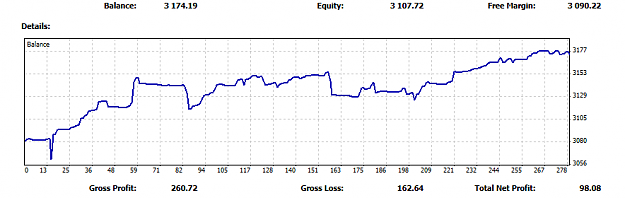
I make a Note of the last FULL £10 gain and "lock it in" so that my Diary shows for example the last BALANCE round number reached. EG (as present, £3150).
Then, I make a note upon each trade of the financial loss or gain where I am in relation to the next £10 Parameter. EG -5, +7, -25.
I will not amend the "Round Number" to a lesser one than the highest point reached. This instantly shows me what work I have to do to recover any short-falls and losses and also what I have to do to get to the next Balance Level, the next £10.
So, my Diary Journal is really just a series of entries on what is almost like a "Shopping List" and is always pushing me to the next £10 target. Once established I then update the Monthly Gain to the next full £10 and start again.
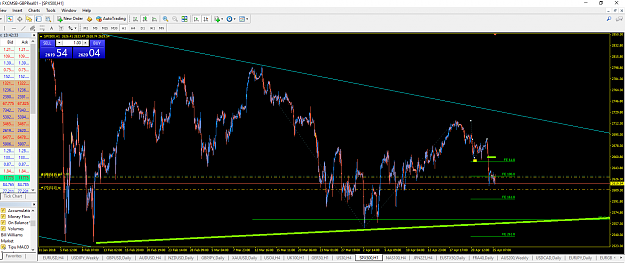
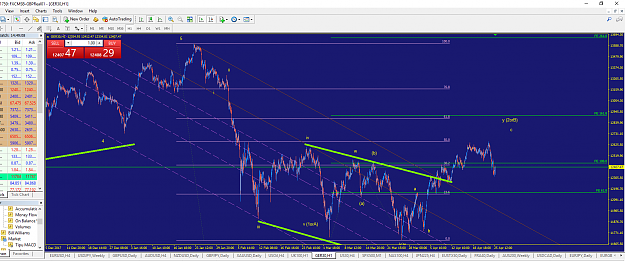
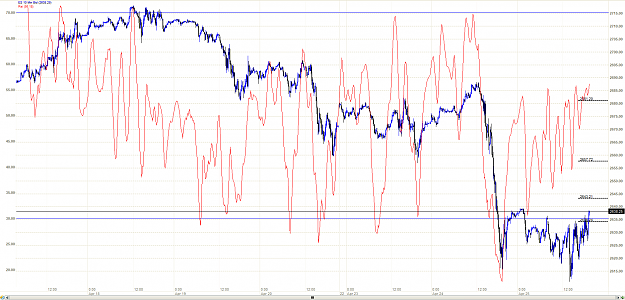
. I am Scalping Long and Short at such a rate that sharing step-by-step is not practical. Price action remains range-bound in SPX and so maybe further downside is warranted and to be expected.... but not guaranteed at all.
Meanwhile, I hit a new Monthly High in realised gains and my Diary reads now as £3160 and "Floating" at +7.
My "Method of Accounting" may be weird to some, but for me it keeps me "On the Ball" and things simple. In practice, if I make £100pm then I am on target to achieve a reasonable annual gain of 40%. Being used to 20% before charges on most decent equities type contracts (pension and Oics and ETFs) this means that I have an "Out-performance" factor in my favour.
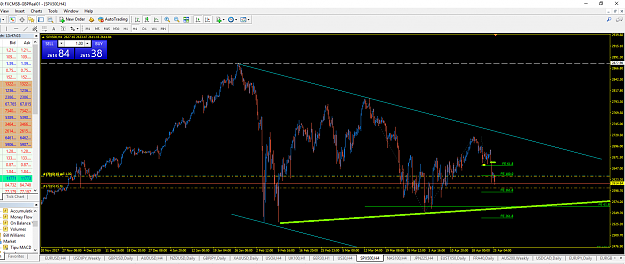
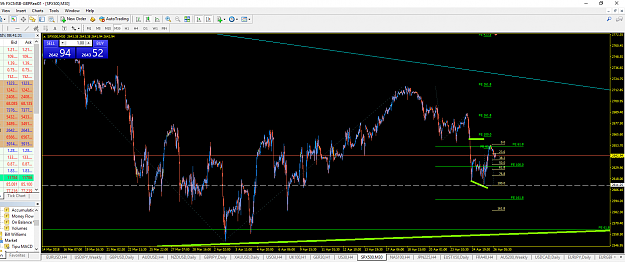
SPX is painting an ambiguous picture. The Triangle may be complete. I would like to think it will have more downside but we could be facing the early stages of a new Impulse which would expect a new all-time high and so there is plenty of scope but not much opportunity to make a certain decision at this point.
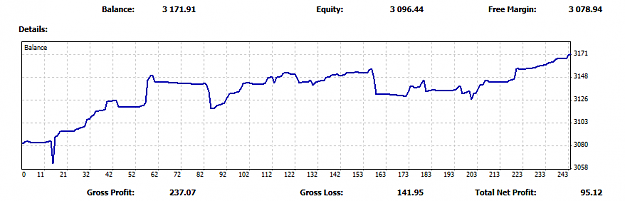
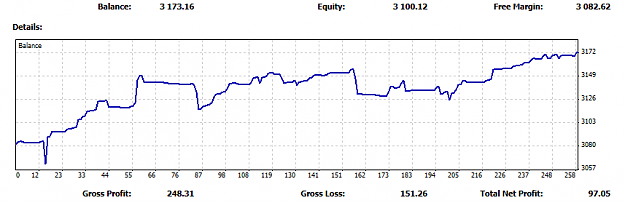
Meanwhile, my Diary reads::: £3170 +3
Requiring just around a further £10 will achieve my £100 monthly gain target and so I suppose I can afford to be patient if I am able to be patient
. It has been quite an eventful day...... in some ways. My lower abdomen is painful and if that is not bad enough upon a "minor trump" while sitting at my desk I actually made a dirty deposit in my pants! This is not something that happens normally and hopefully I will NEVER mention it again
Trading took a back seat and which was a little lacklustre too with an ever-present "Money Come, Money Go Syndrome".
Diary reads £3170 and +4 Floating.
Friday and Monday next will be the final two trading days of April to make up the few pounds needed to accomplish the Target figure..... if my "internals" are up to it
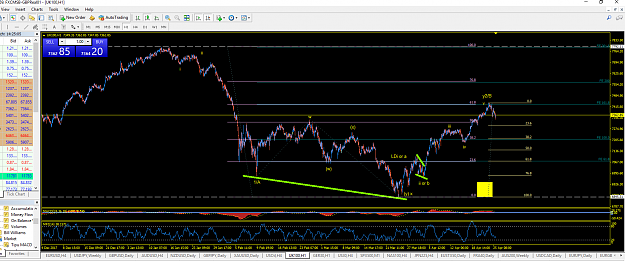
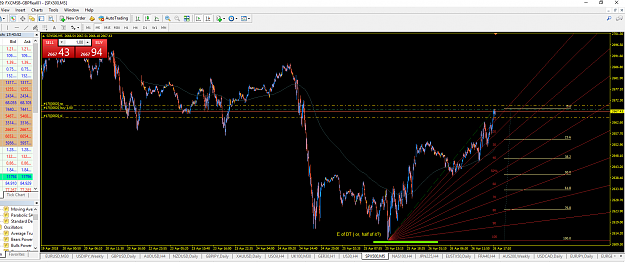
. I can not be so certain that I can safely assume that Wave E of the Triangle at a senior degree is complete. If not we need another Zig-Zag down towards the base line of the triangle.
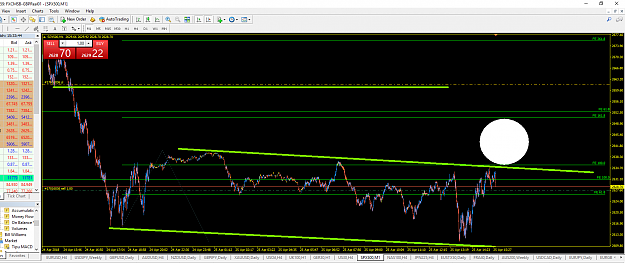
However, I think that we are in a situation where SPX (at least that one and others likely too) can be in the early stages of a Major Move to a new all-time High.
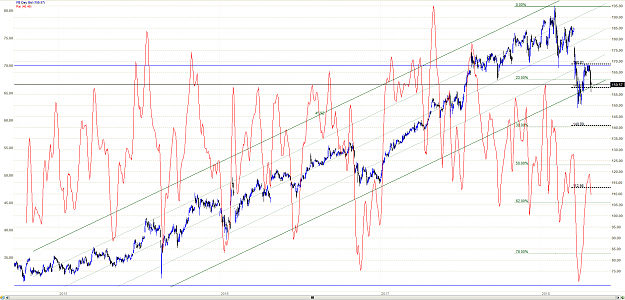
With this in mind, I have established a rather "uncommon" but effective adapted Fibonacci Fan but with the segments at 10% for the purposes of determining pull-backs and also stops for the anticipated Trend.