Disliked{quote} You don't understood me. I didn't open the MetaTrader, I only comment what I saw in the chart image of Strat. The B or BB "candle" of what you are seeing in the W chart are useless. Why do you want to see a candle on B or BB chart that you saw in High Definition on W chart? You need to read more about timeframe and how to use it. You need to read more about Moving Average an how to use it. The numbers 20, 50, 200 are very common, why? I am not using the WCC yet, have more to learn before do it. But, there is a lot to read in this thread...Ignored
I really read your post carefully and try to understand you sentence by sentence. But I still don't understand you. sorry for that.
The B or BB "candle" of what you are seeing in the W chart are useless.
I always post the Bost chart and see the Boss candle in the Boss chart. I didn't see the Boss candle in the Work chart. so I didn't understand what you mean this sentence. Yes, I post one Work chart, but that is just in order to mark in which Boss candle the entry was .
Why do you want to see a candle on B or BB chart that you saw in High Definition on W chart?
Can not understand this sentence too. Again, I didn't see the Boss candle in the Work chart. I first see the Boss chart to look what the Boss chart tell me, and then I turn to the Work chart.
Moving Average
Now you're talking on the other side without giving me a direct answer to the prev question.
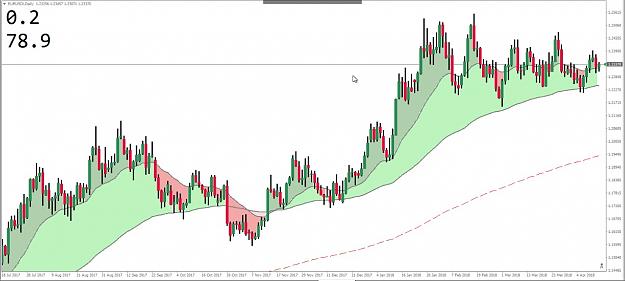
ok, what's the Moving Average telling on Boss chart? Attention that I said Boss chart not Work chart.
63EMA is flat when I think about the 1,2,3 trade, so it is no direction.
20EMA is towards up.
this is my point.
You can see my post pic whice is the Boss chart.
Sorry for my poor english.
thanks
Best regards
Don't Rush Things, Be PATIENT and Wait For the Best Trade Setup