• Home
  • Forums
  • Trades
  • News
  • Calendar
  • Market
  • Brokers
  • Login
  • Join
  • User/Email: Password:
  • 3:43pm
Menu
  • Forums
  • Trades
  • News
  • Calendar
  • Market
  • Brokers
  • Login
  • Join
  • 3:43pm
Sister Sites
  • Metals Mine
  • Energy EXCH
  • Crypto Craft

Options

Bookmark Thread

First Page First Unread Last Page Last Post

Printable Version

  • Interactive Trading
  • /
  • Reply to Thread
  • Subscribe
  • 748
Attachments: Elliot Wave Analysis
Exit Attachments

Elliot Wave Analysis

  • Last Post
  •  
  • Page 1 23456 53
  • Page 1 234 53
  •  
  • Post #1
  • Quote
  • First Post: Feb 17, 2018 6:13am Feb 17, 2018 6:13am
  •  stringfx
  • Joined Nov 2006 | Status: Sting | 776 Posts
Hi..

Just starting a new thread on EW analysis to attract like minded traders. I have noticed other EW threads are declining in posts. I believe that this particular theory is the best to predict future prices along with fibs... I am not an expert in EW but i do try to the best of my ability, so, to all those experts out there, please post your analysis and we will compare our counts to trade better.

Rules are simple..
please don't fight among yourself... there is no right or wrong in this market. Keep calm and have constructive criticism.
Please avoid anything other than trading, so that we concentrate on making some money.

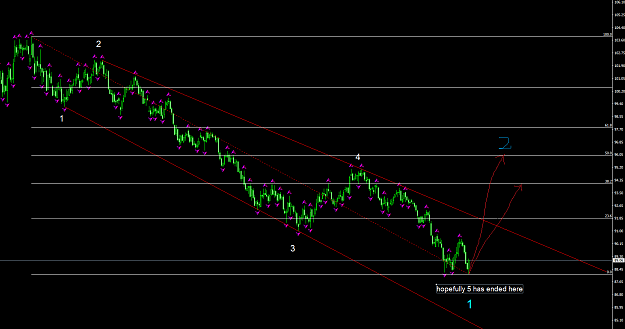
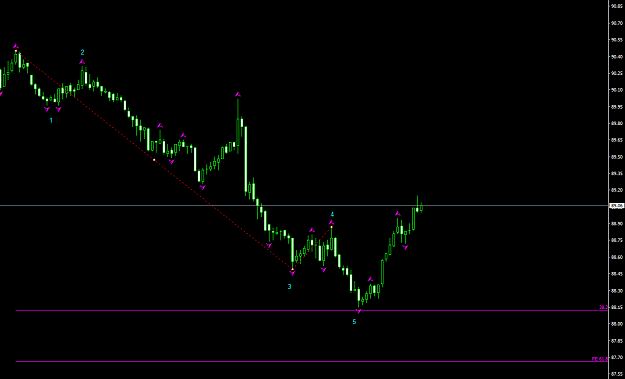
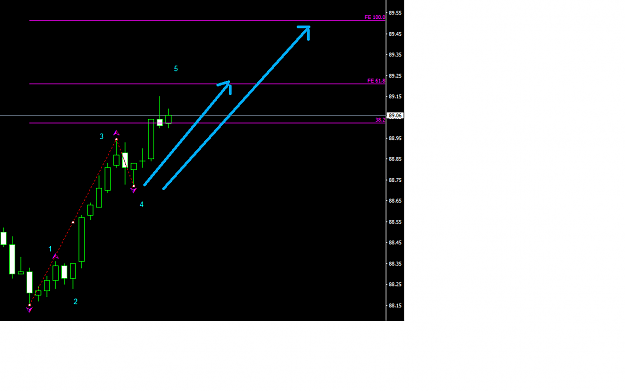
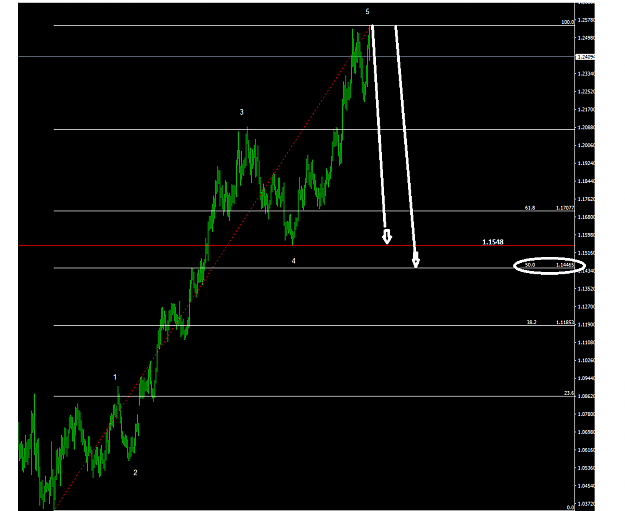
I will post my charts with counts whenever possible. I would prefer to see a daily TF(or higher) and an hourly TF of the instrument that you are posting. i will be concentrating mostly on majors, gold and oil but feel free to post crosses and exotics.

good luck and trade safe.
STING
  • Post #2
  • Quote
  • Feb 17, 2018 6:37am Feb 17, 2018 6:37am
  •  stringfx
  • Joined Nov 2006 | Status: Sting | 776 Posts
Lets start off with DXY chart. Here is a daily chart. I am hoping that 5 th wave has ended for major wave 1. now waiting for wave 2. expecting this will take 3-4 months to complete. If this is a correct count, then a correction to wave 2 will follow. if a new low will not be formed in the coming weeks, then we can buy dollar on dips.
Attached Image (click to enlarge)
Click to Enlarge

Name: dxy daily chart.png
Size: 43 KB
STING
  • Post #3
  • Quote
  • Feb 17, 2018 6:53am Feb 17, 2018 6:53am
  •  stringfx
  • Joined Nov 2006 | Status: Sting | 776 Posts
here are 2 charts on 1 hour.

I am expecting a gap up on dxy on monday morning to wave 5 at 61.8% or even 100% as wave 1. then a decline to 50 % of that move as wave 2. chart will follow once this move is done.
Attached Images (click to enlarge)
Click to Enlarge

Name: dxy 1 hour.png
Size: 20 KB Click to Enlarge

Name: dxy 1hr (1).png
Size: 18 KB
STING
  • Post #4
  • Quote
  • Feb 17, 2018 6:58am Feb 17, 2018 6:58am
  •  stringfx
  • Joined Nov 2006 | Status: Sting | 776 Posts
The same goes with eur/usd. There could be a gap down for wave 1 then a up move for wave 2. If all goes well, we can sell on top of wave 2 for a good down move for wave 3. chart will be the opposite of dxy.
STING
  • Post #5
  • Quote
  • Feb 17, 2018 7:06am Feb 17, 2018 7:06am
  •  stringfx
  • Joined Nov 2006 | Status: Sting | 776 Posts
Please trade with caution, keep your stop losses in place and trade safe. Technical analysis can go wrong anytime and market does what it wants.
STING
  • Post #6
  • Quote
  • Feb 17, 2018 10:42am Feb 17, 2018 10:42am
  •  T4Trade
  • Joined Sep 2017 | Status: Trend Following,Price Action,Marti | 1,558 Posts
very good thread,im not an expert but i do follow Ewave and fib as well.I check higher time frame and 1 hour as well,so i will be following this thread.Thanks
  • Post #7
  • Quote
  • Feb 17, 2018 11:57am Feb 17, 2018 11:57am
  •  stringfx
  • Joined Nov 2006 | Status: Sting | 776 Posts
Quoting T4Trade
Disliked
very good thread,im not an expert but i do follow Ewave and fib as well.I check higher time frame and 1 hour as well,so i will be following this thread.Thanks
Ignored
thanks for stopping by. please contribute whenever you can. Hoping to develop this thread with some good analysis from fellow members.
STING
  • Post #8
  • Quote
  • Feb 17, 2018 1:01pm Feb 17, 2018 1:01pm
  •  stringfx
  • Joined Nov 2006 | Status: Sting | 776 Posts
This is my daily chart on eur/usd. I am hoping the 5th wave has already completed and the major decline for wave 2 has started. We don't know what kind of pattern it will take at the moment. We will see as it develops. 2nd wave is hoped to be finished by 50% of the move but it can go all the way to almost 100% as well. Time will tell us that but for the time being, lets try to digest what's on the table (if the count is correct).
Attached Image (click to enlarge)
Click to Enlarge

Name: eurdaily.png
Size: 36 KB
STING
  • Post #9
  • Quote
  • Feb 17, 2018 1:20pm Feb 17, 2018 1:20pm
  •  stringfx
  • Joined Nov 2006 | Status: Sting | 776 Posts
I have opened a demo trade explorer along with this thread to monitor the trades.
STING
  • Post #10
  • Quote
  • Feb 18, 2018 1:29am Feb 18, 2018 1:29am
  •  stringfx
  • Joined Nov 2006 | Status: Sting | 776 Posts
Good morning...

This would be my hourly count for eur/usd if correct, the picture depicts where i am expecting euro to go this week. wait for wave 2 to complete to take a low risk trade to get wave 3. put stop loss above the start of the 1st wave.
Attached Image (click to enlarge)
Click to Enlarge

Name: eu 1hour.png
Size: 22 KB
STING
  • Post #11
  • Quote
  • Feb 18, 2018 10:30am Feb 18, 2018 10:30am
  •  pet3250
  • Joined Mar 2017 | Status: Member | 243 Posts
Hi Stringfx, thanks for starting this thread, I am interested to learn about Elliot. watching with interest.
Just trying to put a kiss on the cheek of success
  • Post #12
  • Quote
  • Feb 18, 2018 10:45am Feb 18, 2018 10:45am
  •  T4Trade
  • Joined Sep 2017 | Status: Trend Following,Price Action,Marti | 1,558 Posts
Quoting stringfx
Disliked
This is my daily chart on eur/usd. I am hoping the 5th wave has already completed and the major decline for wave 2 has started. We don't know what kind of pattern it will take at the moment. We will see as it develops. 2nd ve is hoped to be finished by 50% of the move but it can go all the way to almost 100% as well. Time will tell us that but for the time being, lets try to digest what's on the table (if the count is correct). {image}
Ignored
please take this as a positive criticism,i am also a learner.the way you have zoomed in daily chart and the way you have drew fib is incomprehensible to me.because according to your analysis one wave lasts for months and months and we only are looking for 10-20 pips per trade.what setting are u using for fib in daily time frame,i use 24 and 90 for 30 min chart to have clearer and nearer future picture.
  • Post #13
  • Quote
  • Feb 18, 2018 12:28pm Feb 18, 2018 12:28pm
  •  stringfx
  • Joined Nov 2006 | Status: Sting | 776 Posts
which chart are you referring to? Is it the daily eur/usd chart? the daily chart is, as you know a longer timeframe and you don't expect to make 20 pips from it. The chart i have displayed on daily should yield nearly a thousand pips (of course not in a straight line). Regarding fibs, I use the in-build fibs on MT4. I use expansion and retracement on fibs. I don't understand the fib setting that you are talking about. If you are talking about fib levels, then i use 38.2,61.8, 138.2,161.8,200,261.8,300 and 361.8. If there is something new on fibs (that i don't know about), please do share here. i normally draw fibs from a swing high to a swing low and find retracement and expansion levels.
Regarding 20 pips moves, you should play around with 15 minute charts and find swing low and high on those. I use a minimum 1 hour chart which is why i do a daily chart to find the direction and then put my counts on hourly chart for 50-100 pips. Hope i made sense. if not let me know or pm me.
STING
  • Post #14
  • Quote
  • Feb 18, 2018 12:31pm Feb 18, 2018 12:31pm
  •  stringfx
  • Joined Nov 2006 | Status: Sting | 776 Posts
Quoting T4Trade
Disliked
{quote} please take this as a positive criticism,i am also a learner.the way you have zoomed in daily chart and the way you have drew fib is incomprehensible to me.because according to your analysis one wave lasts for months and months and we only are looking for 10-20 pips per trade.what setting are u using for fib in daily time frame,i use 24 and 90 for 30 min chart to have clearer and nearer future picture.
Ignored
can you please post a chart with your fibs on it?
STING
  • Post #15
  • Quote
  • Feb 18, 2018 12:38pm Feb 18, 2018 12:38pm
  •  stringfx
  • Joined Nov 2006 | Status: Sting | 776 Posts
Quoting pet3250
Disliked
Hi Stringfx, thanks for starting this thread, I am interested to learn about Elliot. watching with interest.
Ignored
You are welcome ! i am sure you will not be disappointed.
STING
  • Post #16
  • Quote
  • Feb 18, 2018 1:09pm Feb 18, 2018 1:09pm
  •  v2vboni
  • Joined Sep 2015 | Status: ob-la-di, ob-la-da, life goes on... | 3,006 Posts | Invisible
GBP/USD

Attached Image (click to enlarge)
Click to Enlarge

Name: Capture.JPG
Size: 136 KB
Intelligence is the ability to adapt to change. -- Stephen Hawking
  • Post #17
  • Quote
  • Feb 18, 2018 1:49pm Feb 18, 2018 1:49pm
  •  stringfx
  • Joined Nov 2006 | Status: Sting | 776 Posts
Quoting v2vboni
Disliked
GBP/USD {image}
Ignored
Good chart buddy for the 4 hr. hoping for a short as well.
i am not confident of my count on GU which is why i haven't posted it yet. waiting for some more confirmation.

Thanks for the chart.
STING
  • Post #18
  • Quote
  • Feb 19, 2018 12:52am Feb 19, 2018 12:52am
  •  ewgcorp
  • | Joined Jan 2013 | Status: Member | 133 Posts
[attach]gbpusd.PNG;2682284[/attach
Attached Image (click to enlarge)
Click to Enlarge

Name: gbpusd.PNG
Size: 55 KB
choose a job you love and you will never have to work a day in your life
  • Post #19
  • Quote
  • Feb 19, 2018 2:43am Feb 19, 2018 2:43am
  •  stringfx
  • Joined Nov 2006 | Status: Sting | 776 Posts
Dollar is strengthening and corresponding pairs are showing weakness. Iam waiting for bounce up for wave 2 to take a low risk trade down to wave 3 on eurusd.stop will be high of the previous swing. Will be adding sells upon breakout. At the moment sidelined. My te will show my trades. Safe trading to all.
STING
  • Post #20
  • Quote
  • Feb 19, 2018 2:44am Feb 19, 2018 2:44am
  •  stringfx
  • Joined Nov 2006 | Status: Sting | 776 Posts
Quoting ewgcorp
Disliked
[attach]gbpusd.PNG;2682284[/attach {image}
Ignored
Thanks for the chart. Iam at the same confusion of your white wave as well.in that case we need another high.
STING
  • Interactive Trading
  • /
  • Elliot Wave Analysis
  • Reply to Thread
    • Page 1 23456 53
    • Page 1 234 53
1 trader viewing now
  • More
Top of Page
  • Facebook
  • Twitter
About FF
  • Mission
  • Products
  • User Guide
  • Media Kit
  • Blog
  • Contact
FF Products
  • Forums
  • Trades
  • Calendar
  • News
  • Market
  • Brokers
  • Trade Explorer
FF Website
  • Homepage
  • Search
  • Members
  • Report a Bug
Follow FF
  • Facebook
  • Twitter

FF Sister Sites:

  • Metals Mine
  • Energy EXCH
  • Crypto Craft

Forex Factory® is a brand of Fair Economy, Inc.

Terms of Service / ©2021