As per title by mecrandie: "Parabolic SAR Is Simple to Use & Quite Reliable" (???)
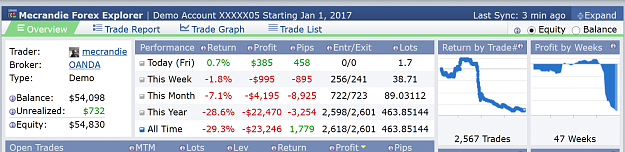
Not much luck this week either with -1.2% loss... Also all green floating pips, our master likes some much are gone and dollars on unrealized profit/loss wise are in negative territory (as per screenshot below)
Weeks in and out losses. Months in and out losses. Years in and out losses. This method has nothing to do with trend trending as somebody suggested. Trend trading might have some extended strings of losses, but eventually will come up with some big wins, covering losses and providing profits. This scammer cannot have any profit for years. YEARS. After over 2000 trades. His win rate is 8.7%. His Sharpie is -0.4 and Sortino -0.36. MINUS. My dump robots are doing better then this.
For an accidental reader, think about this: guy like that offers you mentoring course???
Summary of mecrandie psar method results...
Focusing on annual return:
1 Jan 2015 - 31 Dec 2015 = total return +0.2%, barely positive, in fact negative considering inflation
1 Jan 2016 - 31 Dec 2016 = total return -18.7.%, highly negative
1 Jan 2017 - up to now = total return -27.4%, still counting
Focusing on monthly return in 2017
January = -3.6%
February = -0.5%
March = -0.3%
April = +6.6%
May = -1.5%
June = +2.8%
July = +0.1%
August = +1.0%
September = -6.3%
October = -21.4%
November = -5.5% and still counting
Focusing on recent weeks
Week ending 17/09/2017, LOSS: -2.4%
Week ending 24/09/2017, LOSS: -1.5%
Week ending 01/10/2017, LOSS: -3.4%
Week ending 09/10/2017, LOSS: -7.8%
Week ending 15/10/2017, LOSS: -14.3%
Week ending 21/10/2017, LOSS: -6.1%
Week ending 29/10/2017, WIN: +0.3%
Week ending 05/11/2017, LOSS: -4.9%
Week ending 12/11/2017, LOSS: -1.6%
Week ending 19/11/2017, LOSS: -1.4%
Still counting for the year....
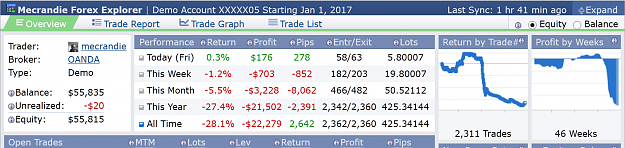
Not much luck this week either with -1.2% loss... Also all green floating pips, our master likes some much are gone and dollars on unrealized profit/loss wise are in negative territory (as per screenshot below)
Weeks in and out losses. Months in and out losses. Years in and out losses. This method has nothing to do with trend trending as somebody suggested. Trend trading might have some extended strings of losses, but eventually will come up with some big wins, covering losses and providing profits. This scammer cannot have any profit for years. YEARS. After over 2000 trades. His win rate is 8.7%. His Sharpie is -0.4 and Sortino -0.36. MINUS. My dump robots are doing better then this.
For an accidental reader, think about this: guy like that offers you mentoring course???
Summary of mecrandie psar method results...
Focusing on annual return:
1 Jan 2015 - 31 Dec 2015 = total return +0.2%, barely positive, in fact negative considering inflation
1 Jan 2016 - 31 Dec 2016 = total return -18.7.%, highly negative
1 Jan 2017 - up to now = total return -27.4%, still counting
Focusing on monthly return in 2017
January = -3.6%
February = -0.5%
March = -0.3%
April = +6.6%
May = -1.5%
June = +2.8%
July = +0.1%
August = +1.0%
September = -6.3%
October = -21.4%
November = -5.5% and still counting
Focusing on recent weeks
Week ending 17/09/2017, LOSS: -2.4%
Week ending 24/09/2017, LOSS: -1.5%
Week ending 01/10/2017, LOSS: -3.4%
Week ending 09/10/2017, LOSS: -7.8%
Week ending 15/10/2017, LOSS: -14.3%
Week ending 21/10/2017, LOSS: -6.1%
Week ending 29/10/2017, WIN: +0.3%
Week ending 05/11/2017, LOSS: -4.9%
Week ending 12/11/2017, LOSS: -1.6%
Week ending 19/11/2017, LOSS: -1.4%
Attached Image (click to enlarge)
Still counting for the year....