Using automatic S&R levels to filter out low probability trades
Just to give you an idea what i'm working on
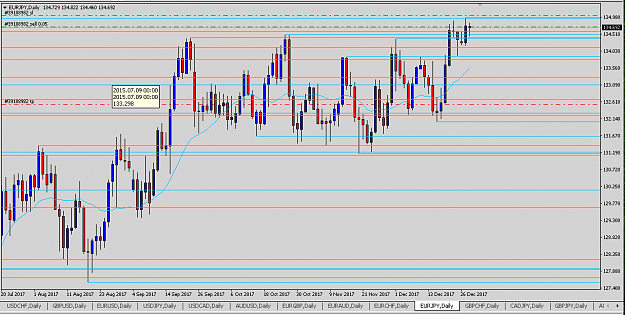
Below are 2 trades which are currently active. One on EURCHF and one on CADCHF. Both are on H4
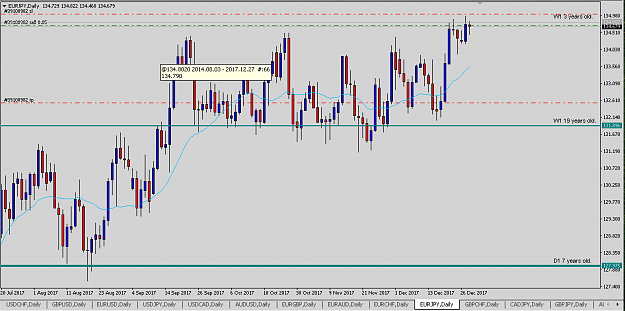
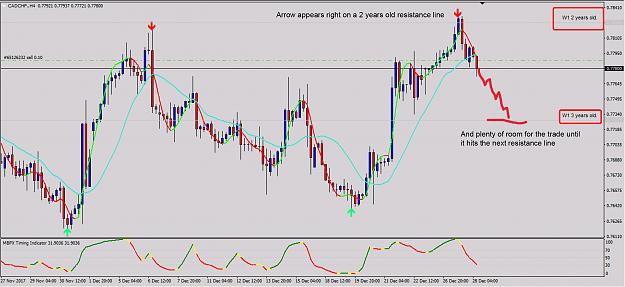
High probability setup: CADCHF
If you look at CADCHF then you'll see that the zigzag arrow appeared right on a S&R level of 2 years old
and that the trade has plenty of room before it will reach the next resistance level of 3 years old.
I would consider this a high probability setup which is likely to give us profit
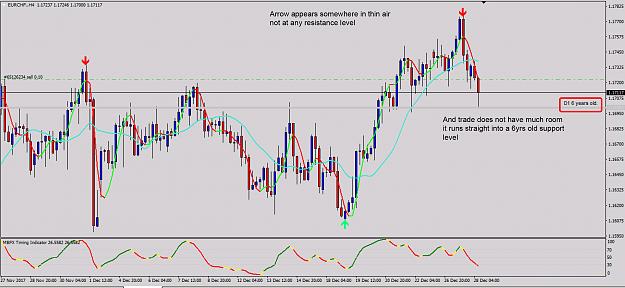
Low probability setup: EURCHF
Now look at EURCHF. The zigzag arrow appeared in empty space with no S&R level in the neighbourhood.
And the trade seems to be running right into a 6yrs old support level
I would consider this a low probability setup where price is likely to bounce up again off the 6yrs old support level.
You already can see some rejection starting to take place
Now the fun part. The S&R levels are from an new indicator i'm working on.(I've attached a beta version so you can test it)
When its finished i want to include it into the EA. That way the EA will know about S&R levels and so it will only take the
high probability setups. Also it would have a rough idea where to place the TP level since that is the next S&R level
Attached Image(s) (click to enlarge)
Attached File(s)
12