If you are tracking EURNZD this week, you may consider the following technical perspective.
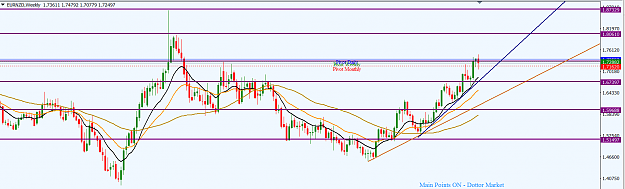
The EURNZD is disposed northward from a technical perspective.
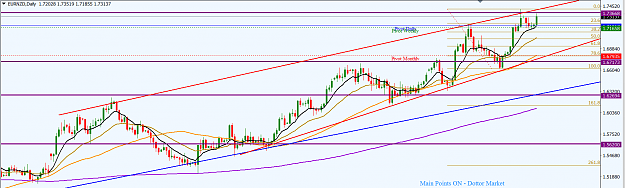
On the daily time frame, price action is operating in a wedge-like channel (bound by two red lines). The most recent price action is proximal to a horizontal resistance zone around the 1.73890 area. Recent price action saw bears pushed price back. Should the bears succeed with a follow-through, we may see a period of consolidation or pullback in the early part of this week before further northward push. A pullback to the 50/61.8 Fib zone of the most recent swing high should be of interest for a buy trading opportunity. This area lies between 1.70580 and 1.68800.
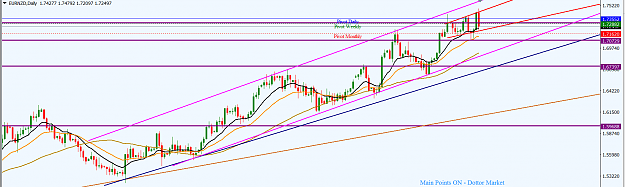
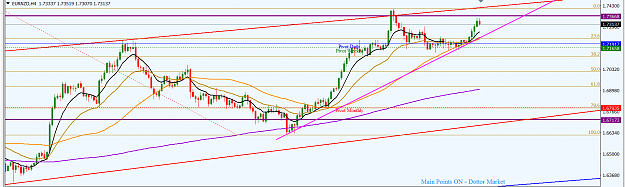
On the H4 time frame, price action is respecting a support trendline (magenta colour). However, neither the bulls nor the bears are in dominance. As price action is proximal to a horizontal resistance, bears may attempt to push price back towards an area of equilibrium, likely below the support trendline (magenta colour). This area is in the 23.6/38.2 Fib zone of the most recent swing high, lying between 1.72300 and 1.71160. Such a move is likely to offer a sell trading opportunity but lingering in such a trade should be avoided as the bigger technical outlook favours the bulls.
I may be wrong. Trade safe and prosper.
KP
The EURNZD is disposed northward from a technical perspective.
On the daily time frame, price action is operating in a wedge-like channel (bound by two red lines). The most recent price action is proximal to a horizontal resistance zone around the 1.73890 area. Recent price action saw bears pushed price back. Should the bears succeed with a follow-through, we may see a period of consolidation or pullback in the early part of this week before further northward push. A pullback to the 50/61.8 Fib zone of the most recent swing high should be of interest for a buy trading opportunity. This area lies between 1.70580 and 1.68800.
On the H4 time frame, price action is respecting a support trendline (magenta colour). However, neither the bulls nor the bears are in dominance. As price action is proximal to a horizontal resistance, bears may attempt to push price back towards an area of equilibrium, likely below the support trendline (magenta colour). This area is in the 23.6/38.2 Fib zone of the most recent swing high, lying between 1.72300 and 1.71160. Such a move is likely to offer a sell trading opportunity but lingering in such a trade should be avoided as the bigger technical outlook favours the bulls.
I may be wrong. Trade safe and prosper.
KP
Attached Image (click to enlarge)
Attached Image (click to enlarge)
Do your homework, follow the footprints of smart money