.....continued from post 2466.....

When dabbling in portfolio magic it is easy to rest on your laurels pinning your hopes on the power of a single system to deliver powerful risk weighted returns....but when you start playing with portfolio development....you enter into a realm where you can continuously improve results through looking for uncorrelated return distributions you can use to ramp up your risk weighted returns.
It is a never ending exercise of continuously looking for unique return distributions that can address different market conditions and assist in reducing the volatility of returns of the portfolio.
Now don't forget that our main game is momentum trading, but do not simply assume that all your eggs should be from the same basket. We actually benefit by adding small amounts of offset by systems offering very different characteristics. In fact the greatest diversification benefits these days comes from system diversification as opposed to instrument or timeframe diversification. The reason for this is that you actually can control the correlation between return distributions by system design as opposed to the potential non-controllable correlation benefits that may or may not be offered by other forms of diversification.
Ramadas suggested to me that I get off my lazy butt and look through my list of long range back-test results for various systems to look for candidates under full automation that we could possibly deploy with the discretionary EDTT to reach for the stars in terms of overall portfolio performance.
Now it is tempting to simply filter out those strategies that have solid risk weighted return metrics and simply select your strategy composition from the best of the best....however as discussed previously....the key to successful portfolio creation is to understand how each system performs in different market conditions and select those system characterictsics that outperform when your primary system under-performs and vice versa....What we are therefore looking for are systems that deliver return distributions that are negatively correlated or uncorrelated with your primary system.
So before we start looking for new systems to complement the portfolio, let's go back to understanding the EDTT portfolio and understand the market conditions where it overperforms and where it underperforms.
EDTT Portfolio Recap
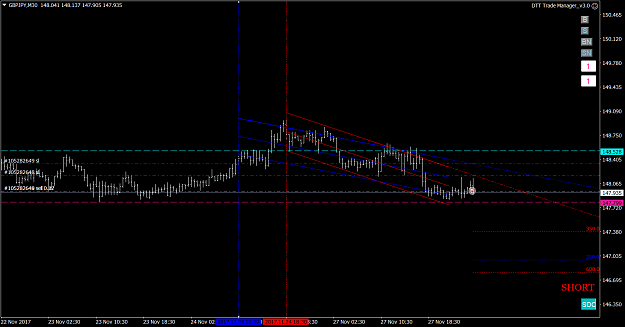
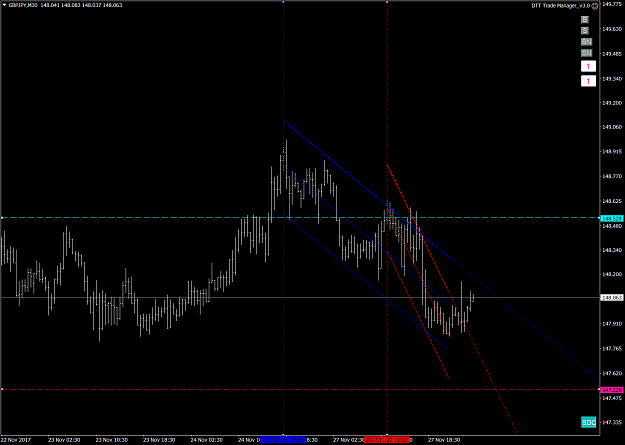
As we are all aware by now, the EDTT is a discretionary trader that capitalises on short sharp momentum breakout trades working outside the range of the normal daily noise of the market. Our pending order entries are located in clear blue sky well away from major prior swing highs and lows and require both a short term and long term momentum confirmation before we pull the trigger and seek to capitalise on the momentum burst.
Given our understanding of the strategy, we can easily determine which market conditions it may thrive in. If we assume that there are two broad market conditions (namely divergent and mean reverting conditions), we can confidently state that the EDTT under it's current configuration will work well in divergent market conditions but may flounder in mean reverting conditions. Furthermore we understand given the breakout nature of this technique and the requirement for short term momentum to persist, that the EDTT is configured well for more volatile conditions and may struggle under lower volatility conditions.
So in a nutshell, because we have taken the time to understand our system and when it performs and when it doesn't we can state with confidence that the EDTT is configured specifically for bull and bear divergent market conditions with above average volatility.
Let's have a look at the equity curve again and think back to to those historical market conditions to better understand our system.
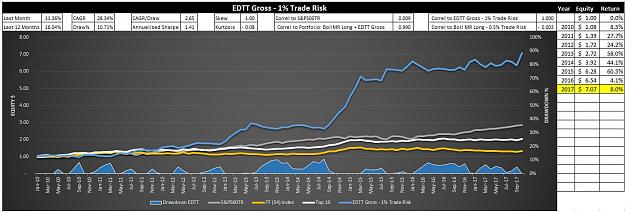
An examination of your equity curve is a great way to see when and where your system performs or under-performs. The equity curve above clearly demonstrates that when volatility picks up and markets start to diverge, the EDTT cleans up as it did between November 2012 to May 2013 and between August 2014 to March 2015. These were periods of market divergence across a broad range of asset classes....and we also find that the majority of the professional TF funds also prospered during these regimes. However outside these divergent periods where mean reversion and low volatility has prevailed, the trend following community has been generally languishing under these conditions with building drawdowns.
Fortunately the EDTT given it's very efficient nature in capturing momentum and short term nature, was able to navigate these ugly market conditions without significantly eating into it's capital. Drawdowns were maintained and we were actually able to retain our capital and slightly build the pot.
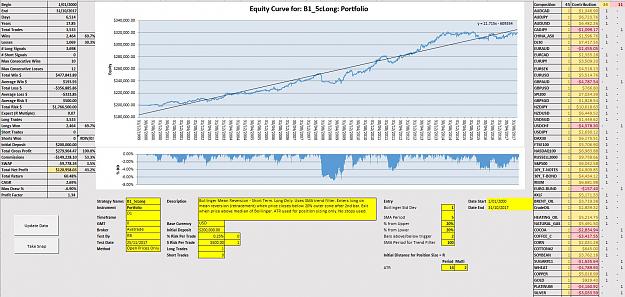
Now in general, when looking at the excellent performance metrics of the EDTT, it is easy to rest on your laurels and assume that adding a further system to the portfolio is worthless.....however this post is going to challenge that perception. Just remember before we embark on this portfolio enhancement exercise that the EDTT Gross (that trades a universe of 24 instruments across a broad range of asset classes) has produced the following performance metrics since 1 January 2010 to 31 October 2017:
- A CAGR of 28.34% (which has turned $1 into $7.07 by the end of the period);
- A max drawdown of 10.71% over the period; and
- A MAR ratio (CAGR/Max Draw) of 2.65.
So can we get better than this?
Given our understanding of the EDTT and when it prevails and when it doesn't, we can now better describe alternative systems that may help to shine when the EDTT underperforms and strictly manage capital when the EDTT outperforms.
So what we are after is a system that flourishes when the EDTT doesn't. We already know that the EDTT is configured for volatile divergent market conditions, so we are therefore looking for another short term trader of a similar trade duration that performs well in convergent (mean reverting) conditions of low volatility. What this means through understanding how your system ticks is that you can already partially define the characteristics you are looking for before you even need to turn to your correlation tables to look for alternatives.
A System that Might Fill the Gap
So I have spent the weekend trawling through my system backtests looking for potential candidates. Remember how I said that a portfolio manager is very much like a bower bird in that they keep their backtests for potential future use. I must admit I am a system horder in that you just never know when a system that you have relegated to the sin bin may be of future use to a portfolio.
I was looking for mean reverting systems that had a short holding period and came upon a solution that is so departed from the technique of the EDTT that it might just respond to those difficult market conditions faced by the EDTT and produce a totally uncorrelated equity curve that would help to flatline the equity curve of the porttolio.
Here are the performance results of the system I came across.
Let's have a close look at this fully automated system.
It doesn't look like much. It produces a CAGR of 2.69% with a max drawdown of 6.9% for the 17.8 year period. Normally as a retail trader you would throw this system in the bin....but it has exactly the characteristics we are looking for. Let's step through them:
1. It trades a broader universe of 45 instruments that will assist in producing an uncorrelated result against the 24 instruments traded by the EDTT;
2. It appears to have a slight edge in that it produced a profitable result across 34 instruments of the total portfolio and was efficient in restricting the losses on unfavourable instruments. This is important as you don't want any outliers that pull the results of the total portfolio down when they are added to the mix.
3. It trades off the D1 timeframe which is a different timeframe to the EDTT (M30) and this feature will assist in producing an uncorrelated relationship;
4. It only trades long which will also assist in offering an uncorrelated relationship with the EDTT that trades both long and short; and
5. It is a mean reversion trader with a Pwin of 70% and a Win$:Loss$ of 193.33/333.85 = 0.58 and will offer an uncorrelated relationship with the EDTT.
A description of the system is as follows: It is a short term Bollinger Band Mean reverting system on the D1 timeframe that uses an SMA filter to only take long trades. It uses a Bollinger Band with the following settings:
1. 1 Std dev;
2. SMA period = 5
We deploy upper and lower bands within the Bollinger band 20% from the upper band and 20% from the lower band.
To enter the trade we wait until the open price is above the 200 SMA filter and on the open following 2 prior daily closes below the lower 20% band (given that we are trading long) and provided the open is also below the 20% lower band.
We use the ATR (14/2) to determine position sizing.
We do not use stops given that this is a mean reverting trader but we do use performance exits when price on the open is above the median of the Bollinger band.
So now that we understand the mechanics of this mean reverting system let's see how we can mix this with the EDTT to see if it is a worthwhile inclusion into the portfolio.
Before we start blending the first thing we do is scale the strategy in accordance with our risk tolerance. As discussed in prior posts I am a risk nazi and do not like my drawdowns to be excessive. I set my volatility tolerance levels to a max historic drawdown of approximately 10%. Given that our worst drawdown will always be in the future as the Law of Large numbers starts to take hold, my assumption is that I will pull the pin on my portfolio if a max drawdown of 20% is achieved. By scaling my tolerance to 10%, I am conservatively pitching my position sizing to ensure I stay in the game a long time.
So with a 0.25% trade risk we achieved a CAGR of 2.69% with a max drawdown of 6.9%. If we therefore double our trade risk % to 0.5% we should come somewhere close to a 10% max draw. Remember however that our performance results are across a 17 year plus time horizon. In comparing apples for apples, I want to compare performance metrics against the testing period of the EDTT which is from 1 Jan 2010 to 31 October 2017.
Here is what is achieved with the long only Bollinger Mean Reverting system (Boll MR Long 0.5% trade risk) when comparing results across the timeframe 1 Jan 2010 to 31 Oct 2017.
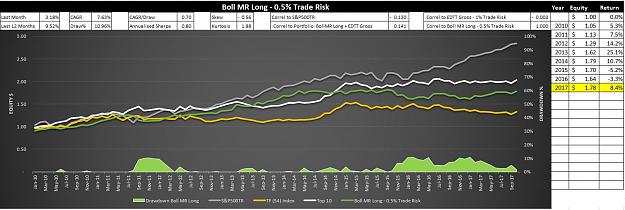
So we have a CAGR of 7.63% and a max draw of 10.96% with a MAR of 0.70. It certainly doesn't look much on its own does it? Let's look at it's visual relationship with the EDTT to see if it can offer any positive performance offsets.
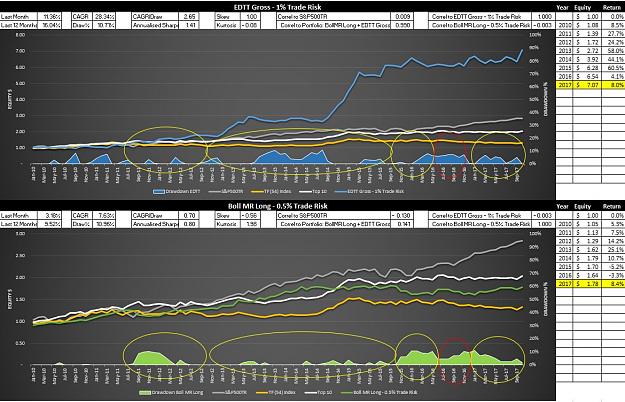
Comparison of Drawdowns
I have lined up the equity curves of both the EDTT and the Boll MR Long system to compare and contrast the different drawdown profiles. Yellow zones are mutually offsetting drawdown periods. Red zones are non-beneficial periods where no offset is achieved. You can see through this visual examination of drawdown profiles that both systems will significant mutually benefit each other in reducing volatility. This is further confirmed by the correlation statistics that reflects that both systems are almost perfectly uncorrelated with each other. This bodes well for a portfolio synthesis.
Let's see the Blended result
Now remember the performance statistics of the EDTT in isolation that we are trying to beat with a blended portfolio and yet still achieve the same low drawdown result of approximately 10%? I will refresh your memories of the performance stats of the EDTT at the beginning of this post.
- A CAGR of 28.34% (which has turned $1 into $7.07 by the end of the period);
- A max drawdown of 10.71% over the period; and
- A MAR ratio (CAGR/Max Draw) of 2.65.
Here we go. The blended result.
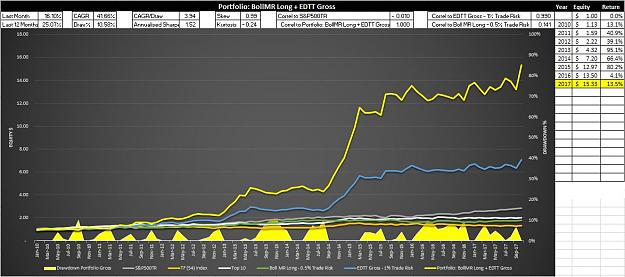
How do you like them apples?
- A CAGR of 41.66% (which has turned $1 into $15.33 by the end of the period);
- A max drawdown of 10.58% over the period; and
- A MAR ratio (CAGR/Max Draw) of 3.94.
Yippeee. So how did we scale this? Remember that the dominant system of the strategy is the EDTT. We do not want to dwarf it's great results through an equal weighted blend of strategies of 50% to 50%. What we wanted to do was to leverage from the great results of the EDTT and use the Boll MR long system to simply assist in offsetting the volatility of returns of the EDTT so we could magnify the position size of the EDTT accordingly and get bigger bang for buck.
Previously to achieve a max drawdown of approximately 10% for the EDTT in isolation, we could only apply a position sizing of 1% trade risk. With the Boll MR strategy in isolation we could only adopt a 0.5% trade risk to achieve a max drawdown of approximately 10%. Now under a blended arrangement we can now apply a position sizing of EDTT of 1.31%to get bigger bang for buck out of this solid performer and only a 0.19% trade risk for the Boll MR strategy to assist in flattening the equity curve of the portfolio. In scaling the portfolio through this allocation technique I have almost doubled the returns of the combined strategy for the same level of drawdown.
Now that's something to sing about.
Have a great trading week guys.....and thanks Ramadas for the excellent idea :-)
Cheers
C