There are many indicators, that you could use in the Forex Market. Thus you need to have a proper amount of knowledge and experience and skills to make some good money online.
{quote} It would be very nice if we can have it for MT4 kprsa, please share if you have free time, thank you in advance. It doesn't matter if it is only in EX4 format, at least we can see how it works ...
Ignored
There you go.
In my opinion it is best used in combination with "Force" which is basically ATR (i.e. a proxy for market interest/volume): One should always go along the direction which shows an increase of market interest.
{quote} There you go. In my opinion it is best used in combination with "Force" which is basically ATR (i.e. a proxy for market interest/volume): One should always go along the direction which shows an increase of market interest. Cheers, k {file}
Ignored
I use a fraction of ATR for my risk analysis equation. I was never impressed by indicator based systems which just stated things like "50 pip stop loss" without talking about volatility or specific pairs.
Hi all,
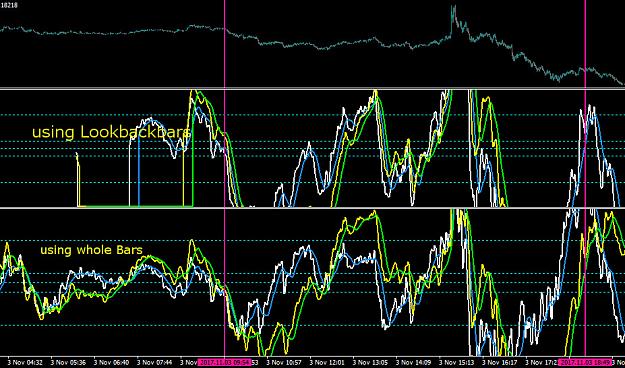
I have a simple beginner question about limiting bars to use for calculation in one indicator. I do not know why the result of using the whole Bars gives me different result than using limiting bars (lets say 2,000 or 20,000 bars in TF M1). Please look at my image below, between the two red vertical lines, the result of my oscillator are different, actually they have the same setting, except the amount of bars for its calculation ...
Does it means that my code has bugs in it ? I just learn to code, so some bugs is really possible (although i have re checked it twice, but still can not find any wrong). If in some cases it is possible that amount of bars will give different result, How many bars shall we use as our reference / what is the Right Setting for every calculation ? Must we use different bars for different TF ? Any clue / idea is welcome. Gracias.
Attached Image (click to enlarge)
I am failed,but i found 1,000 ways that won't work ...
Hi all, I have a simple beginner question about limiting bars to use for calculation in one indicator. I do not know why the result of using the whole Bars gives me different result than using limiting bars (lets say 2,000 or 20,000 bars in TF M1). Please look at my image below, between the two red vertical lines, the result of my oscillator are different, actually they have the same setting, except the amount of bars for its calculation ... Does it means that my code has bugs in it ? I just learn to code, so some bugs is really...
Ignored
Without having any information on the indicator to me it looks like either:
1. Your indicator uses entire history to calculate its value. Even if this were true, I'd expect the blue and white line to be less prone to it (they clearly have a shorter period), and yet they differ above and below.
2. Your indicator relies on finite amount of data (period length) and has a bug/programming logic issue of some sort.
4. In order for price to change direction, a period of elevated spread (=High-Low) is necessary. The price acts like a slingshot in those areas: if the Low is more distant from the Close than the High (and the price is at the end of a significant down move), the "price slingshot" is shooting up which can only be stopped by an eventual price slingshot shooting down. Cheers, k {image}
Ignored
Hey kprsa, I read over the most important post of the thread again and stuck at the point above. What exactly do you mean by "a period of elevated spread". Increased in comparison to the previous trend? Even in the image of your next post I can't see that spread widens (if we calculate the spread vertically). Thanks in advance for your clarification!
{quote} Increased in comparison to the previous trend?
Ignored
"Increased" comparing to the average candle. Point being, price movements usually don't stop at short candles (except for no interest areas). The reversal candles are pinbars/railroad tracks/M-W patterns/slingshots. The bigger they are normally, the bigger the resistance to the previous price direction, the farther the price can fly and the more difficult is to stop it when it gets going.
I usually did the scalping on the 1h tf and there the variety was quite large.
k
{quote} "Increased" comparing to the average candle. Point being, price movements usually don't stop at short candles (except for no interest areas). The reversal candles are pinbars/railroad tracks/M-W patterns/slingshots. The bigger they are normally, the bigger the resistance to the previous price direction, the farther the price can fly and the more difficult is to stop it when it gets going. I usually did the scalping on the 1h tf and there the variety was quite...
Ignored
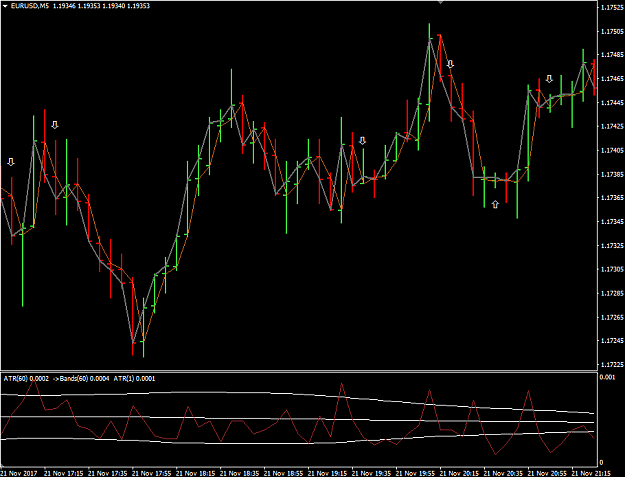
Ok, then the setups would be like this (cf. attached chart). We wait until we detect a high-range candle. On the next candle the open (brown) and close line (grey) should switch to confirm the setup. Then we could enter the candle with the white arrow ...
{quote} Ok, then the setups would be like this (cf. attached chart). We wait until we detect a high-range candle. On the next candle the open (brown) and close line (grey) should switch to confirm the setup. Then we could enter the candle with the white arrow ... {image}
Ignored
I suspect the results would be better when a person is trying to do it, you get a "feeling" for price movement, and such things are difficult to program (the "rules" arose from staring at the chart and trying to figure out what is important from what is not).
Cheers,
k
{quote} Ok, then the setups would be like this (cf. attached chart). We wait until we detect a high-range candle. On the next candle the open (brown) and close line (grey) should switch to confirm the setup. Then we could enter the candle with the white arrow ... {image}
Ignored
Hi AntiCre,
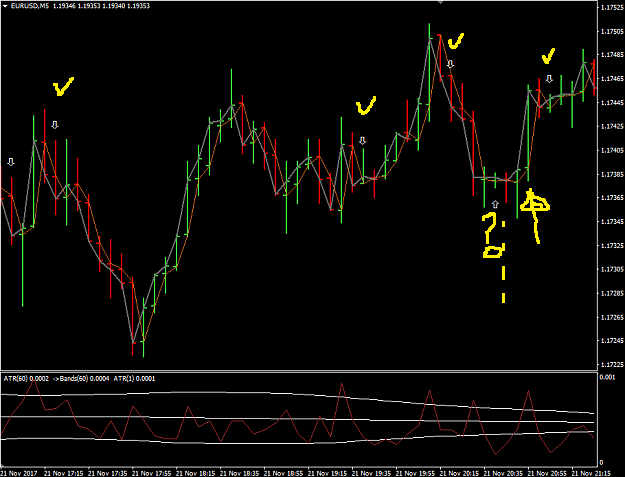
I edit some Part of your image (please see Attachment Below), if i understand it right, all the lines are drawn using MT4 Default tools lines (brown & grey) ? In your example, it is set for M5, can it be used for all tf too ? If we look at the yellow color, i put a question sign there (exactly at your up arrow) , as i see the red candle is big Enough (EDIT : i mean the big red candle at 2 previous candle before your arrow position) , but Not really reach the average candle Requirement ? At the point of my yellow arrow, because of the 2 previous red candle's range before this yellow arrow is too small, this signal is also not Valid ?
If I look at your open line (brown) and close line (grey), i am thinking of HLOC price of each candle, they are all having same important information. And at one of my previous image, the dot is drawn exactly at flip candle, but using HiLo lines (using similar flip function), will try to combine them. Gracias.
Attached Image
I am failed,but i found 1,000 ways that won't work ...
Most public indicators can be traded and they will produce positive returns, when a good exit plan has being traded alongside. If you do follow the indicator's logic: buy here, sell there, one day you will fail. However, if you figure out how to flip sides among the signals, the indicator starts bringing income on a regular base. For example, I did not expect substaintial incomes to be made with moving averages (not with the ma crosses! there are million other profitable ways to use a ma...), zig zags, breakouts, OCHL prices, trend lines, grids,...
Ignored
Interesting post MoneyZilla ! Exit plan having same important as Entry plan in my opinion, and some times as a beginner, i must wait for several hours (up to 10 hrs) just to get an entry signal on M1 tf , this can be boring for some people ... using this bad scalping idea just to close an order immediately after getting some pips . Entry plan must be prepared properly by using available good indicators to get signal on bigger tf (for example: on M15 tf), it can take 10 - 15 hrs of my time by sitting in front of monitor and always watching on chart before i jump in to the market, and Close it as soon as possible at the best Price i can get. A friend told me that a professional trader just need some minutes (may be not more than 10 minutes ) to get Same good entry signal on All TF : from M1 or H4 , using whatever indicator (even some times just using candle stick information, no other indicator is needed) ... this is really wonderful. If that information is true, than there is some thing wrong with my setup, and surely need much more improving ... Could you please give any idea, how a professional trader can do this very fast ? Gracias.
I am failed,but i found 1,000 ways that won't work ...
{quote} Hi AntiCre, I edit some Part of your image (please see Attachment Below), if i understand it right, all the lines are drawn using MT4 Default tools lines (brown & grey) ? In your example, it is set for M5, can it be used for all tf too ? If we look at the yellow color, i put a question sign there (exactly at your up arrow) , as i see the red candle is big Enough (EDIT : i mean the big red candle at 2 previous candle before your arrow position) , but Not really reach the average candle Requirement ? At the point of my yellow arrow, because...
Ignored
Hi, this was just a small idea I hacked together. In the chart window you see the BB for the ATR 60 (I've hidden this ATR line). Additionally I've put a ATR(1) in there to see the range of each bar. If that range exceeds the BB of ATR(60) then I considered that range for relatively high. Afterwards I'd like to see that the relative position of close and open to each other change their position, then enter. I think it could be applied on every TF. There are many signals, however, not all work (it's trading). I haven't checked any further info (like ranging in previous candles) before drawing the arrows manually. It is not a system - I've just drawn it to get response from kprsa.
{quote}Could you please give any idea, how a professional trader can do this very fast?
Ignored
I am a hobby trader. Have no idea what is the pro trader mindset. My goals are pathetic. Steady 25% a week. At least. That is not a pro trader way of thinking...
Due to the countless failures I was involved in... had to studiy most of them. Looking for what caused them and why? Then i started to see patterns of behaviours. I guess the pro trader mentors deliver that type od details directly...
When reading a chart and you see it going up, the indicator obviously goes up too. It isn't telling you anything you don't already know. Then an indicator can go in that "overbought" area and stay there for a long time. You can see that too on a chart if price keeps going higher and higher with no pull backs. Then it leaves the overbought area and comes down, well guess what, you can see that on the chart too looking at the candlesticks.
So why do you need an indicator?
Better time spent learning how to read a chart and patterns than investing time figuring out some magical indicator.
When reading a chart and you see it going up, the indicator obviously goes up too.
Ignored
This is not true. An indicator can be going "down", or be "red", when price is going up. It is true that most would prefer to see an indicator going up as price goes up, but that is not a necessity.
It isn't telling you anything you don't already know.
Ignored
Again this is not necessarily true. Sure, one can create an indicator that gives a +1 every time the closing price is greater than the previous closing price. Which can easily been seen by looking at a chart. But most indicators are looking at large data sets, or are looking at non obvious data points. For example, is the absolute body range (O-C) of the current interval 2x the average of the last 12 body ranges that were greater than the previous body range?
So why do you need an indicator? Better time spent learning how to read a chart and patterns than investing time figuring out some magical indicator.
Ignored
Before getting into "why" one might need an indicator, there is something that must be understood by all:
Every indicator ever, is always 100% correct. That's right. Every MACD reading, every Money Flow reading, every RSI reading, every VSA sign of weakness (SOW), every indicator is correct.
That's not to say that every indicator has actual value, but it is to say that indicators by definition do one thing: Indicate. It is 100% true, that when your MACD crosses the zero line from below, that the shorter moving average has moved above the longer moving average. Does that mean price will rise? Maybe. Maybe not. But it does absolutely mean that as long as the MACD is green, the shorter average is above the longer one. Period.
Of curse it matters what one is trying to indicate, with an indicator. Yet, an indicator based on a faulty premise, will still be 100% correct. It will just be 100% correct based on a faulty premise.
Then an indicator can go into that "overbought" area and stay there for a long time.
Ignored
Again, this gets into use and or faulty premise. There is no such thing as "overbought or "oversold". For every buyer there is a seller. Markets don't go up, because there are more buyers than sellers. They go up because the buyers are more aggressive than the sellers. The buyers are willing to hit the ask, more so than sellers are willing to hit the bid. Therefore, looking for an indication of an "overbought" situation in the market is a faulty premise. And yet, when your indicator moves above some pre-determined level you call "overbought", it is 100% correct-the algorithm is producing an output number greater than said level.
Indicators don't move markets; they indicate certain underlying conditions. Just because the indicator on your screen is in "overbought" territory, that does not mean the market will fall.
Without VSA, you're playing checkers while the Smart Money plays chess.
{quote} This is not true. An indicator can be going "down", or be "red", when price is going up. It is true that most would prefer to see an indicator going up as price goes up, but that is not a necessity. {quote} Again this is not necessarily true. Sure, one can create an indicator that gives a +1 every time the closing price is greater than the previous closing price. Which can easily been seen by looking at a chart. But most indicators are looking at large data sets, or are looking at non obvious data points. For example, is the absolute body...
Ignored
Everything you said is true. I still believe they are not useful. The only thing I can see for it's purpose would to have it as a visual to make sure what you see on the chart is coinciding with the indicator if you like to see an macd cross or whatever i guess. But the indicator alone can show a cross up and some newbie may think oh wow it's going up ill buy now and in fact it's in a down trend and a few hours later wham, are losing money. The indicators cannot blindly help anyone determine if they should buy or sell. It all depends on the situation and the situation is never the same every time. Plus since it depends on the situation and if you are smart enough to know it's in a down trend and it shows a buy and you know not to take it then... did you need the indicator to begin with? Cus,. if you know not to buy it then, you should know when to sell it when going with trend the other direction.
Just my two cents lol. But I see a lot of people trying to use macd, rsi, cci, atr, etc and also figuring out perfect settings for them on top of that and I personally feel you could be spending time practicing and/or reading something to gain knowledge and experience.
If people started trading forex from daily charts on demo and learning when to get in and out using some good risk management, then once you are successful with that move to lower time frames and repeat. That would be more useful than combing through indicators to help you.
I don't mean to be a downer but for anyone reading this if you use indicators and it makes you better than keep doing it. If you have spent months using indicators and you haven't improved at all, well look into something else.
Any body know which indicator is the best one for showing candle of bigger TF ? I use M candle indicator that i found here. But some times i see that it will only draw until the close price of last hour on Friday (lets say we put it on M1 and choose H1 as bigger TF). Especially if there is gap between Friday close and Monday open, we can clearly see the candle line is not completely drawn until Monday (the big candle line is only until Friday close).
Use one or two indicators but only as a guide. You profit more by doing a top-down analysis and trading based on the broader directional outlook; then confirm with your indicator at a lower tf for entry.
Trade safe and prosper.
KP
Do your homework, follow the footprints of smart money