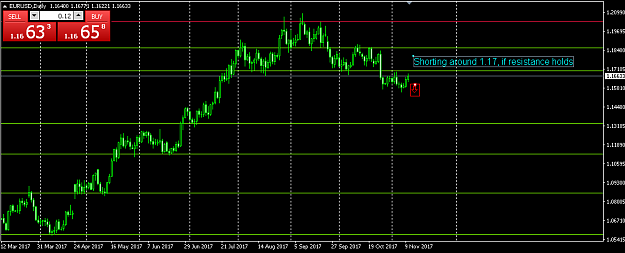
Disliked{quote}{quote} Hi JM, This is the major issue with Trading, we are both looking at exactly the same chart and seeing different things. I see a Level of Buying that is getting weaker... Below that I see Bullish Imbalance that has not yet been filled... Below that I see a Level that the Bulls have defended... but for how much longer... {image}Ignored
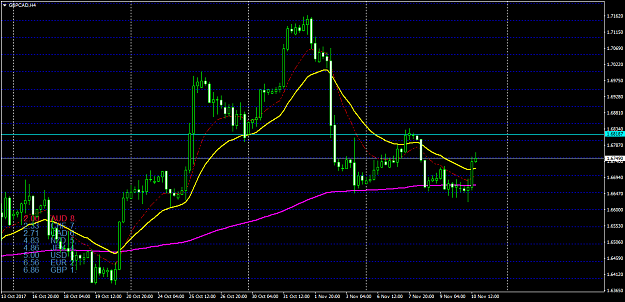
Did you actually watch that video in the first post. I presume you didn't because you think you don't need to, right? OK let me then tell you what we're trying to do with this particular system on this particular thread. We are trying to use the past to predict the future. We believe that the BB's use past support/resistance areas on the 4 hour chart to access their target areas in the future. Thus, taking GBPCAD as an example, if you had actually taken the time to watch the video, you would realise that there are numerous cluster areas below the present price action would could arrest the clear match of price action downwards. This has actually occurred already as we still struggling to get through the 1.4750 area and that has been the case since Monday evening!!
What I would suggest Stevepatt is that you start your own thread. Then you can punt your own views and your own system to your heart's content! OK?
Regards
JM
4