• Home
  • Forums
  • Trades
  • News
  • Calendar
  • Market
  • Brokers
  • Login
  • Join
  • User/Email: Password:
  • 8:07pm
Menu
  • Forums
  • Trades
  • News
  • Calendar
  • Market
  • Brokers
  • Login
  • Join
  • 8:07pm
Sister Sites
  • Metals Mine
  • Energy EXCH
  • Crypto Craft

Options

Bookmark Thread

First Page First Unread Last Page Last Post

Printable Version

Similar Threads

Planetary cycles, astrological theory of cycles of the markets 492 replies

Planetary / Astrology indicators 3 replies

Forecast Forex using Numeric Cycles and Astrology Cycles 32 replies

Planetary Cycles... Plotting Cycles into the Future 0 replies

Opinions on "Planetary cycles, astrological theory .. of the markets" 40 replies

  • Interactive Trading
  • /
  • Reply to Thread
  • Subscribe

Planetary Cycles Trading (EUR/USD)

  • Last Post
  •  
  • 1 435436Page 437438439 605
  • 1 Page 437 605
  •  
  • Post #8,721
  • Quote
  • Nov 3, 2017 11:05pm Nov 3, 2017 11:05pm
  •  jnevins
  • Joined Feb 2007 | Status: Member | 2,098 Posts
End of week recap....
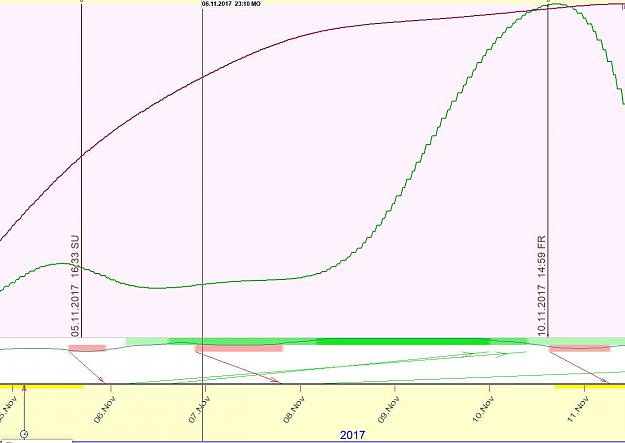
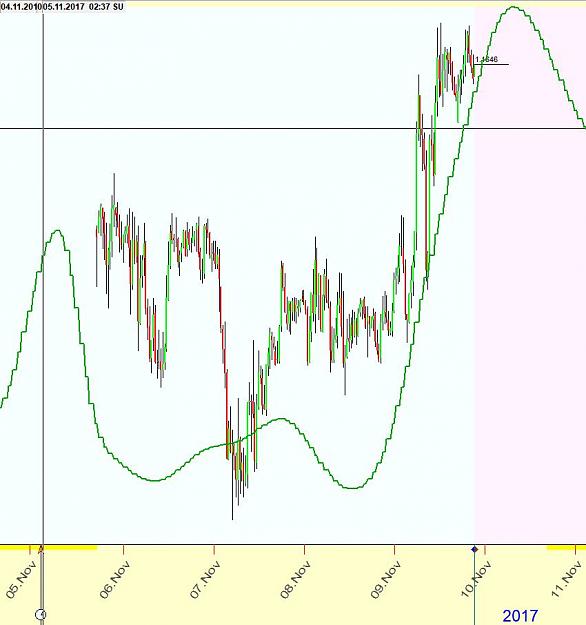
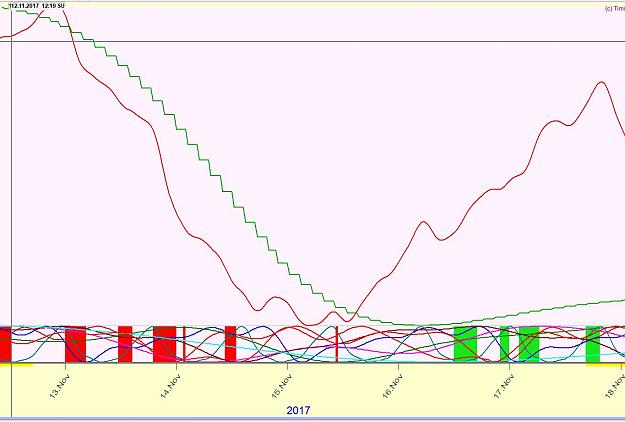
EUR/USD 30 min EDT

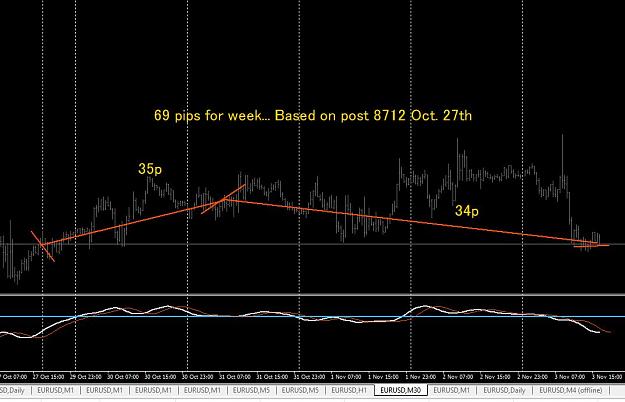
It was a quiet week overall... still, post 8712 managed to call the general swing for a profit of 69 pips....
Attached Image (click to enlarge)
Click to Enlarge

Name: Capture.JPG
Size: 95 KB
1
  • Post #8,722
  • Quote
  • Nov 5, 2017 12:18am Nov 5, 2017 12:18am
  •  jnevins
  • Joined Feb 2007 | Status: Member | 2,098 Posts
Outlook for next week EUR/USD

Up week in store....
Green line=Mars-Mars 6h, 100% sm orb
Brick red line= Jupiter-Venus 8h 500% sm orb
Attached Image (click to enlarge)
Click to Enlarge

Name: Capture.JPG
Size: 83 KB
1
  • Post #8,723
  • Quote
  • Nov 5, 2017 7:13am Nov 5, 2017 7:13am
  •  Joseph95
  • Joined Jan 2017 | Status: Member | 379 Posts
As a passionate astronomer and very mentally open, I can only be curious about this "unusual" trading approach. If anyone could help me understand, giving me the right .tpl for starting observe the charts, I would be grateful
  • Post #8,724
  • Quote
  • Nov 5, 2017 12:54pm Nov 5, 2017 12:54pm
  •  jnevins
  • Joined Feb 2007 | Status: Member | 2,098 Posts
Quoting Joseph95
Disliked
As a passionate astronomer and very mentally open, I can only be curious about this "unusual" trading approach. If anyone could help me understand, giving me the right .tpl for starting observe the charts, I would be grateful
Ignored
I'm studying astronomy as a window into future price action in the EUR/USD on the assumption that correlation does not necessarily mean causation. I acknowledge that it is very difficult for our 21st century minds to grasp the possibility that astronomical events could have anything to do with the movements of financial markets. The study of esoteric methods for predicting market movements is a long, difficult one... the strongest model we have is W.D. Gann but there are many more examples out there.

Timing Solution software presents a deep tool box to begin to explore this idea. There are numerous articles on the home website, timingsolution.com . I have been running an ongoing experiment of posting a prediction for the week for the EUR/USD for 80 some odd weeks now and following up at the end of the trading week with a recap. I am just beginning the process of looking back to see how it stacks up from a statistical point of view.
2
  • Post #8,725
  • Quote
  • Nov 5, 2017 12:57pm Nov 5, 2017 12:57pm
  •  jnevins
  • Joined Feb 2007 | Status: Member | 2,098 Posts
My above post, 8722 looks counter intuitive when one considers the weekly and daily charts from a regular TA point of view.... Here is a daily view then a weekly chart The top daily one is from from George Smith's excellent newsletter... http://www.forex-trading-made-ez.com/fx110317.html
Attached Image (click to enlarge)
Click to Enlarge

Name: Capture1.JPG
Size: 66 KB
Attached Image
1
  • Post #8,726
  • Quote
  • Nov 5, 2017 1:36pm Nov 5, 2017 1:36pm
  •  parisboy
  • Joined Oct 2017 | Status: Member | 5,046 Posts
Jeremy notice the Envelopes parameters, calculated according my interpretation of Gann's Law of Vibration

Graph shows 6 months of Data. Origin : TradingView

Attached Image (click to enlarge)
Click to Enlarge

Name: EURUSD 6 MONTHS 5 NOVEMBRE 2017.jpg
Size: 186 KB
  • Post #8,727
  • Quote
  • Nov 9, 2017 10:17pm Nov 9, 2017 10:17pm
  •  jnevins
  • Joined Feb 2007 | Status: Member | 2,098 Posts
Thursday night update... Here is the Mars-Mars 6h with a 33% smooth orb instead of 100% smoothing posted in post # 8722, Nov 5th...
Attached Image (click to enlarge)
Click to Enlarge

Name: Capture.JPG
Size: 75 KB
2
  • Post #8,728
  • Quote
  • Nov 10, 2017 12:40pm Nov 10, 2017 12:40pm
  •  F.g
  • Joined Aug 2016 | Status: Member | 3,776 Posts
Great Jerry !!!
and now the why of this upmove.
During this week 4-10 Nov 17 there was in effect a Grand Trine in HELIO .
Merc. conj. Pluto trine Mars trine Earth
Plus the last trine of Saturn to Ouranus in GEO.this Saturday.

  • Post #8,729
  • Quote
  • Nov 10, 2017 6:05pm Nov 10, 2017 6:05pm
  •  jnevins
  • Joined Feb 2007 | Status: Member | 2,098 Posts
End of the week recap... EUR/USD 30 min EST

130 pips for week Mars-Mars 6h... Mars in Libra, 7th house... Mars=4 + Mars=4 + 7 (th house) = 15, reduces to 6, thus 6th harmonic.
Attached Image (click to enlarge)
Click to Enlarge

Name: Capture.JPG
Size: 115 KB
1
  • Post #8,730
  • Quote
  • Nov 10, 2017 8:27pm Nov 10, 2017 8:27pm
  •  Richterzoo
  • | Joined Jul 2013 | Status: Member | 71 Posts
Was visiting the thread. It has been a while since I've been been here. I noticed the indicators are not working with the latest MT4. Can anyone send me the files that are working? Example, aspects_v02, etc. Many thanks in advance.

Jim
  • Post #8,731
  • Quote
  • Nov 11, 2017 12:08am Nov 11, 2017 12:08am
  •  jnevins
  • Joined Feb 2007 | Status: Member | 2,098 Posts
First look for next week...

Resumption of downtrend but choppy trip... downward pressure should start 00:00 Monday through 02:00 Friday EST. The Moon is crossing Mars, Jupiter and Venus this week and the forecast is a bit more difficult than in other weeks.

Navy line is Q Spectrum 1190 bars cycle
Orange line Saturn-Uranus 98h 50% sm orb.
Attached Image (click to enlarge)
Click to Enlarge

Name: Capture.JPG
Size: 87 KB
1
  • Post #8,732
  • Quote
  • Nov 11, 2017 12:12am Nov 11, 2017 12:12am
  •  jnevins
  • Joined Feb 2007 | Status: Member | 2,098 Posts
Quoting Richterzoo
Disliked
Was visiting the thread. It has been a while since I've been been here. I noticed the indicators are not working with the latest MT4. Can anyone send me the files that are working? Example, aspects_v02, etc. Many thanks in advance. Jim
Ignored

Have you tried the version posted on May 30 by PaulSelvan? You could pm him if you are having trouble getting it to work...
Attached Image (click to enlarge)
Click to Enlarge

Name: Capture1.JPG
Size: 72 KB
1
  • Post #8,733
  • Quote
  • Nov 11, 2017 10:57pm Nov 11, 2017 10:57pm
  •  jnevins
  • Joined Feb 2007 | Status: Member | 2,098 Posts
Another view of next week... EUR/USD 30 min EST

Red=Q spectru, 10-5000 bars, top 5 auto selected
Green =Uranus-Saturn 91h 100%sm orb. 91 was selected as Uranus, 6 is in 1st house=7 and Saturn, 6 is in 9th house= 7+6=13
I needed the harmonic to be a high one so 7X13=91h...
Attached Image (click to enlarge)
Click to Enlarge

Name: Capture.JPG
Size: 120 KB
1
  • Post #8,734
  • Quote
  • Nov 12, 2017 7:49am Nov 12, 2017 7:49am
  •  F.g
  • Joined Aug 2016 | Status: Member | 3,776 Posts
A reason to believe we got a reversal top in E and BPound is the fact we have 2 A LINE crossings during the weekend. Besides the very important Sat. TRINE[3] Ouranus .
Mars at 192* on Fri. 13:46

Venus 216* on Sunday 1:34

I am short big .

happy star gazing

  • Post #8,735
  • Quote
  • Nov 12, 2017 2:15pm Nov 12, 2017 2:15pm
  •  F.g
  • Joined Aug 2016 | Status: Member | 3,776 Posts
Dear Sixer hi.
I have saved a copy of a chart you posted many months ago in this thread depicting an annual forecast made by Larry Williams for Euro.

It shows a Low in Febr. 2017 and a top on 16 Nov. which is this coming Thu.

It gives me the impression of an inversion . It will be a significant LOW . Great signatures add to this idea .
Long term heavyweights on 11/11 and 2/12 [Sat trine Ouranus and Jup. trine Neptune ] plus Neptune DIRECT on 22/11

Shorter term events include Mars 150 Nept. 9/11

Venus trine Neptune - Sun trine Chiron - Sun 150*Ouranus 17/11 - Venus opp. Ouranus HELIO 18/11 - Mars sq. Pluto and Mars 144* Neptune 19/11

Center of gravity ~~~16-17 /11

What is your opinion ?

  • Post #8,736
  • Quote
  • Nov 13, 2017 3:25pm Nov 13, 2017 3:25pm
  •  paulselvan
  • Joined Jul 2013 | Status: Member | 318 Posts
Hi Ritchterzoo,
As you requested the pg by pm ...
--------------------
Put the attached files in right directories.
--------------

...MQL4\indicators\selvan_aspect_v04.mq4
...MQL4\Libraries\swedll32.dll
...MQL4\Include\selvan_aspects_include.mqh
Attached File
File Type: mq4 selvan_aspects_v04.mq4   21 KB | 336 downloads
Attached File
File Type: mqh selvan_aspects_include.mqh   12 KB | 328 downloads
Attached File
File Type: zip swedll32.zip   228 KB | 343 downloads
1
  • Post #8,737
  • Quote
  • Nov 13, 2017 8:11pm Nov 13, 2017 8:11pm
  •  Richterzoo
  • | Joined Jul 2013 | Status: Member | 71 Posts
Thanks Paul
  • Post #8,738
  • Quote
  • Nov 13, 2017 11:45pm Nov 13, 2017 11:45pm
  •  Sixer
  • Joined Nov 2008 | Status: Member | 1,757 Posts
F.g,

based on the Delta cycle count of the Daily EURUSD chart, an inversion in the Intermediate Term Cycle (blue) is possible.
The Medium Term Count (red) indicates a low - no inversion.

The Long Term Count (black) by using Weekly data shows a possible Flat correction until febr 2018.

I don`t know which model LW used for his prediction(s).

Sixer
Attached Images (click to enlarge)
Click to Enlarge

Name: D-EURUSD(D)-13.11.17.gif
Size: 46 KB Click to Enlarge

Name: D-EURUSD(W)-13.11.17.gif
Size: 41 KB
2
  • Post #8,739
  • Quote
  • Edited at 11:37am Nov 14, 2017 11:21am | Edited at 11:37am
  •  paulselvan
  • Joined Jul 2013 | Status: Member | 318 Posts
Hi Richterzoo,
Here is attached how to use selvan_aspects_v04 indicator with an example.
As you can see in the below m5 chart by 2 times DJ bottom occurs when the indicator shows Moon Square or Trine the Ascendant
Attached Image (click to enlarge)
Click to Enlarge

Name: m5.jpg
Size: 129 KB

Attached File
File Type: doc Astro.doc   839 KB | 396 downloads
1
  • Post #8,740
  • Quote
  • Nov 14, 2017 2:14pm Nov 14, 2017 2:14pm
  •  F.g
  • Joined Aug 2016 | Status: Member | 3,776 Posts
..... Very BIG mistake to ignore the fact that Moon entered Libra 180* on Monday 18:26 .....

These mistakes cost a lot of money . . . .

  • Interactive Trading
  • /
  • Planetary Cycles Trading (EUR/USD)
  • Reply to Thread
    • 1 435436Page 437438439 605
    • 1 Page 437 605
1 trader viewing now
  • More
Top of Page
  • Facebook
  • Twitter
About FF
  • Mission
  • Products
  • User Guide
  • Media Kit
  • Blog
  • Contact
FF Products
  • Forums
  • Trades
  • Calendar
  • News
  • Market
  • Brokers
  • Trade Explorer
FF Website
  • Homepage
  • Search
  • Members
  • Report a Bug
Follow FF
  • Facebook
  • Twitter

FF Sister Sites:

  • Metals Mine
  • Energy EXCH
  • Crypto Craft

Forex Factory® is a brand of Fair Economy, Inc.

Terms of Service / ©2021