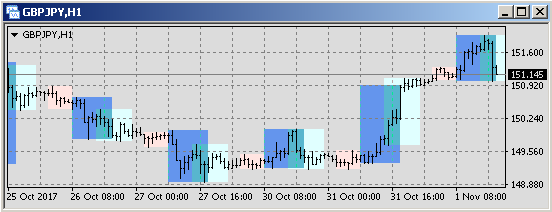
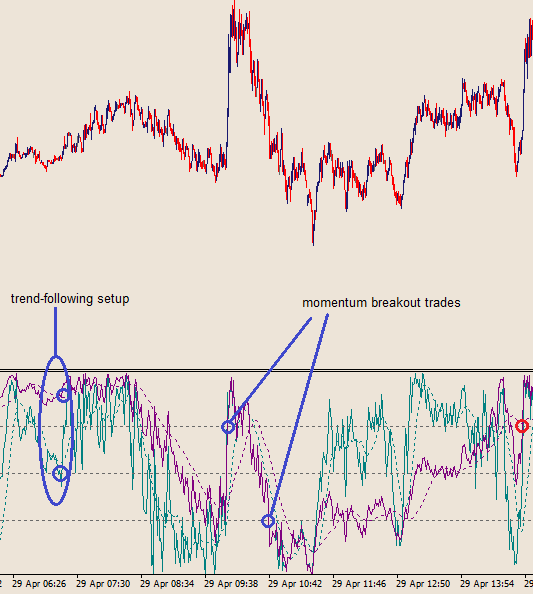
Disliked{quote} Exactly. We can either interpret it as boundaries or we look at it in terms of momentum. You can see that recently prize didn't leave its upper prize range. Thus, prize went up due to your 151-momentum(*). Now use another momentum, compare it with the picture above and tell me where you could have entered and why. I think there are two possibilities: Enter after a new trend started when both (or more) momenta lines break out of a predefined level. Re-enter if long-term momentum is still high but low-term momentum became weaker and now strenghtens...Ignored
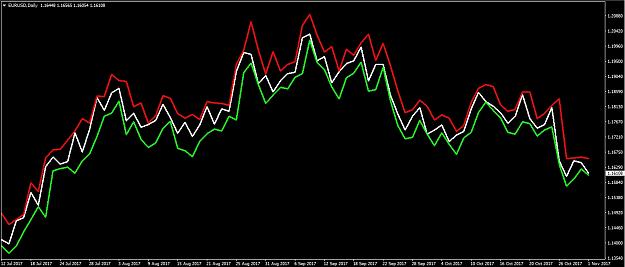
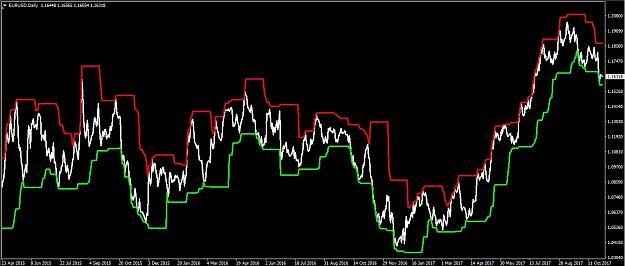
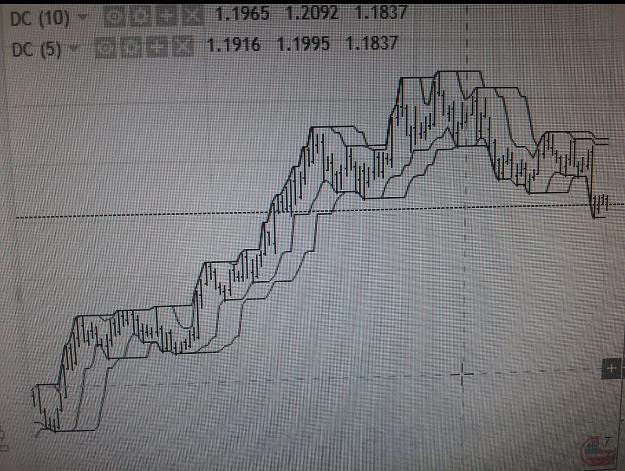
This allowed them to see a shorter and longer momentum.
On breakouts the shorted and longer donchians merged together. On consolidations they diverged.
Attached Image (click to enlarge)
The truth is hidden from you
2