I'm not a fan of 'day of the week' patterns, or any wisdom that advocates avoiding trading on any particular weekday. My research leads me to believe the markets are cyclical and that what works or didn't work on one day could work on a different day. Sure, some days have historically higher volumes than others, and so some strategies might depend on that, but it isn't the weekday that determines success or failure any more than the orbits of planets, etc. Just my belief.
However it does seem likely that there could be weekly patterns (cycles) just as there are definitely daily patterns (cycles) since institutions follow weekly schedules.
I recently watched a video by Michael J. Huddleston, where he states the following. (watch on YouTube and start at 2:02:10)
A lot of bet-hedging there, covering (nearly) 3 out of 5 trading days for a potential weekly high. Still I thought the statement was good in so far that it can be tested and falsified, so it's already better than 90% of the price action 'advice' out there.
My research so far shows that it is at best, highly inaccurate. However while building my tables I did find something interesting. I blocked out the weekly ranges on a D1 chart of EURUSD over 51 trading weeks and selected the weekly high and low. I chose to focus on two annual periods, the current year-to-date, and the year 2010; the year before Huddleston's video was recorded. If there's some interest in more data, I will do a similar breakdown of another instrument.
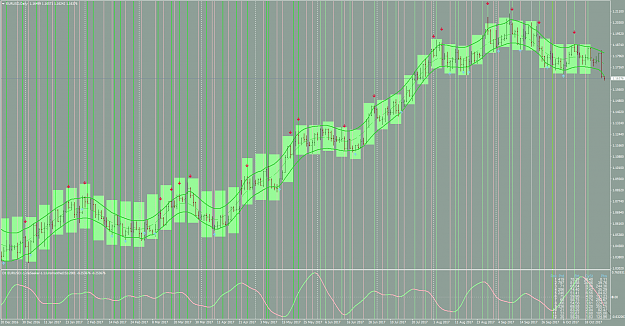
Table here:
https://docs.google.com/spreadsheets...ETlNxZxxmOKZ6s
What I found was that in 2010, the most likely day on which a high or low would fall was Friday (not Monday, Tuesday or Wednesday as it turns out). The difference between Friday, and Monday or Tuesday, the next two most likely days, is statistically significant. Of course this could be unique to EURUSD and maybe Huddleston was referencing a different instrument, one he didn't specify.
In 2017 YTD the most likely day on EURUSD is by far, Monday, with Friday a close second. The likelihood that Friday will contain the weekly high has also been statistically significant.
I suspect this is all a symptom of cyclicality, and now that EURUSD is coming down from a long-term (D1,W1) peak these days might change, and the pattern of lows/highs might change.
However what I find most interesting, and unusual, is the difference in highs/lows between Monday and Tuesday (or in 2010, between Friday and Thursday). Tuesday is the least likely day to contain a weekly high or low, by quite a bit.
I've been trying to decide what this means, if anything, and what I've concluded so far is that Tuesday is a 'straight-through' day, gutless, in a manner of speaking, taking its cues mostly from Monday's price action and extending into Wednesday more often than not. In other words Tuesday has been the least 'reversible' day of the week during the period studied. This, if true, and if the pattern is stable, should be tradeable.
Here's a chart, showing what would happen if you simply traded in the direction of Monday's trend starting a few hours before the NY close, through Tuesday, YTD.
Yellow lines are wining trades; orange are losing. Cyan vertical lines are Monday bars. The success rate is about 65% as-is. With some logical stop rule and maybe a filter condition(?) I'm sure this could be improved.
I thought I'd share this tidbit with some brighter brains than mine in the hopes that we can come up with something more concrete and useful. There might also be some better way to approach this information that I've overlooked.
However it does seem likely that there could be weekly patterns (cycles) just as there are definitely daily patterns (cycles) since institutions follow weekly schedules.
I recently watched a video by Michael J. Huddleston, where he states the following.
Inserted Video
QuoteDislikedOne of the strongest million dollar concepts is to anticipate the weekly high or low to form between Sunday's open and Tuesday's London Open. When it fails to unfold, (how would you know for sure?) the high or low will likely post in between the Tuesday London Open and the Wednesday London Open!
A lot of bet-hedging there, covering (nearly) 3 out of 5 trading days for a potential weekly high. Still I thought the statement was good in so far that it can be tested and falsified, so it's already better than 90% of the price action 'advice' out there.
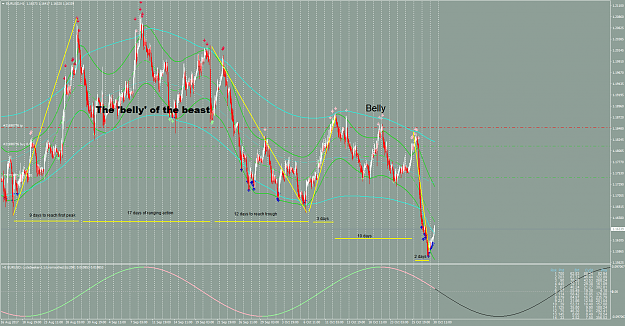
My research so far shows that it is at best, highly inaccurate. However while building my tables I did find something interesting. I blocked out the weekly ranges on a D1 chart of EURUSD over 51 trading weeks and selected the weekly high and low. I chose to focus on two annual periods, the current year-to-date, and the year 2010; the year before Huddleston's video was recorded. If there's some interest in more data, I will do a similar breakdown of another instrument.
Attached Image (click to enlarge)
Table here:
https://docs.google.com/spreadsheets...ETlNxZxxmOKZ6s
What I found was that in 2010, the most likely day on which a high or low would fall was Friday (not Monday, Tuesday or Wednesday as it turns out). The difference between Friday, and Monday or Tuesday, the next two most likely days, is statistically significant. Of course this could be unique to EURUSD and maybe Huddleston was referencing a different instrument, one he didn't specify.
In 2017 YTD the most likely day on EURUSD is by far, Monday, with Friday a close second. The likelihood that Friday will contain the weekly high has also been statistically significant.
I suspect this is all a symptom of cyclicality, and now that EURUSD is coming down from a long-term (D1,W1) peak these days might change, and the pattern of lows/highs might change.
However what I find most interesting, and unusual, is the difference in highs/lows between Monday and Tuesday (or in 2010, between Friday and Thursday). Tuesday is the least likely day to contain a weekly high or low, by quite a bit.
I've been trying to decide what this means, if anything, and what I've concluded so far is that Tuesday is a 'straight-through' day, gutless, in a manner of speaking, taking its cues mostly from Monday's price action and extending into Wednesday more often than not. In other words Tuesday has been the least 'reversible' day of the week during the period studied. This, if true, and if the pattern is stable, should be tradeable.
Here's a chart, showing what would happen if you simply traded in the direction of Monday's trend starting a few hours before the NY close, through Tuesday, YTD.
Attached Image (click to enlarge)
Yellow lines are wining trades; orange are losing. Cyan vertical lines are Monday bars. The success rate is about 65% as-is. With some logical stop rule and maybe a filter condition(?) I'm sure this could be improved.
I thought I'd share this tidbit with some brighter brains than mine in the hopes that we can come up with something more concrete and useful. There might also be some better way to approach this information that I've overlooked.