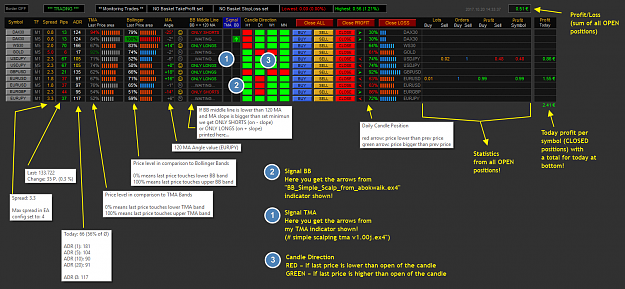
I'm working on a multi pair/multi timeframe dashboard for this method.
As shown in one of my charts here in the thread I prefer the TMA bands more than the bollinger bands so I included both "signals" in the dashboard.
I also like a "good slope" of the 120 MA in order to take a trade (e.g. no trade when slope of 120 MA is smaller than 7.5 degree). So I included a MA Slope column.
All other things shown in the dashboard should be self-explaining.
At this stage of coding the dashboard is a "info dashboard only" so it will not autotrade any signals.
You can click buy/sell/close buttons in the middle to open a position.
You can also click the symbol name (left) so it opens this chart with the desired timeframe (you can set a template name which is applied to that opened chart).
Give me a few more days to tidy everything up and I will upload the EA here.
Have a nice weekend!
Attached Image (click to enlarge)
12