EDTT Versus Traditional Trend Following - The Difference is all in the Trade Efficiency
We have the results below up to September 2017 for the Professional Fund Managers who practice the shady art of Trend Following.
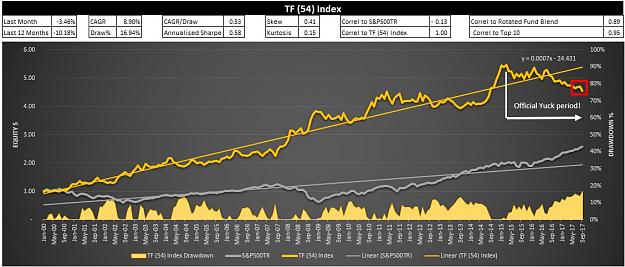
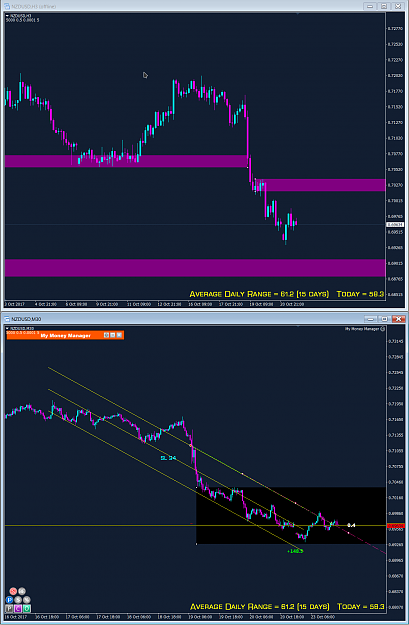
September was a further blow to the trend following community which simply continues the poor performance results since February 2017 where the slide in performance is now leading to historical max drawdowns of 16.94% for 54 of the top trend following funds who have been in operation from 1 Jan 2000 to current day.
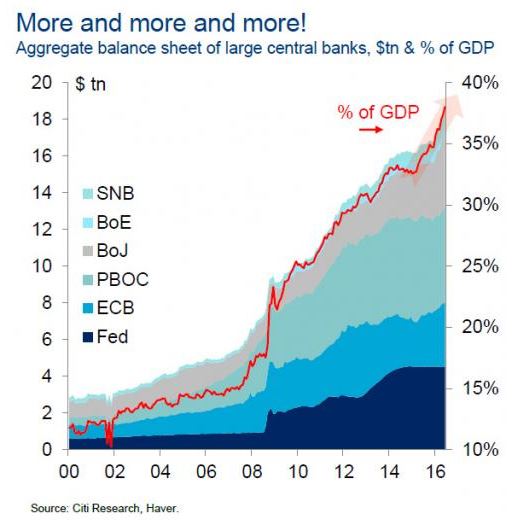
The reason for this slide in performance can be attributed to central bank intervention which has led to broad scale investment in bonds and equities through the glut of printed money. For example since 2010 over 14 trillion dollars have been injected into the financial markets through quantitative easing. During 2017 approximately $1 Trillion or roughly $250 billion per month has been injected into the financial system....and it needs to find a home somewhere...which it has in US Treasury bonds and equities.
The chart below sums up this never ending mistake of propping up a faltering western economy.
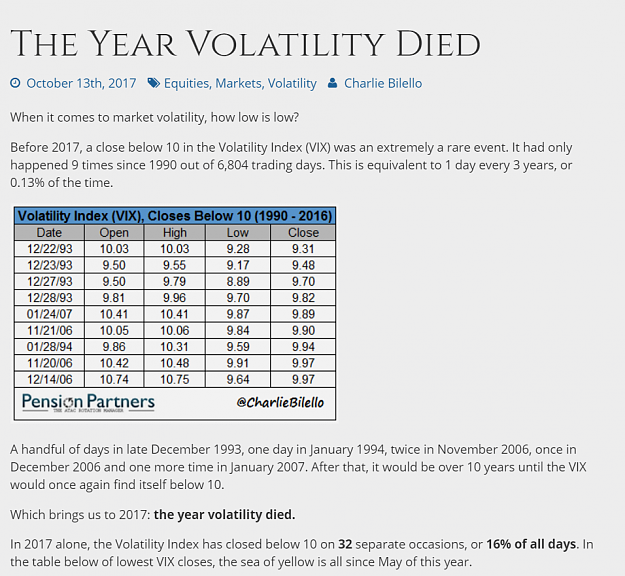
So now that we understand the cause, we can then understand the symptoms. Here is the performance of the S&P500 total return index (including dividends) since intervention following the GFC. If you look hard you might be able to discern the impact of the GFC in 2008 that is now dwarfed by the bull run that is not founded in solid economic terms, but rather is a direct result of failed economic policy. To any sane human being with a dose of common sense, you can therefore understand that this is not sustainable and we are probably gaping into the jaws of a severe meltdown that is likely to shadow the intervened result of the GFC.
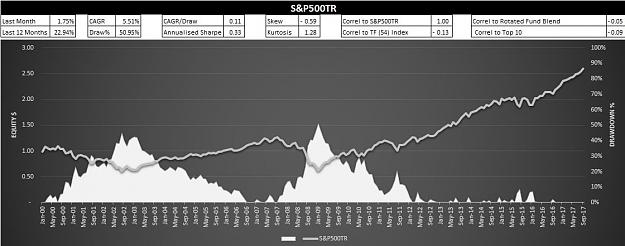
Now with this context as a backdrop, you can understand that the Commodity Trading Advisors (CTA's) represented as diversified trend followers have been having a historically hard time over the same period....as the performance results of the CTA's are un-correlated with the S&P500TR Index.
So in a nutshell....the trend following community while experiencing difficult times and simply doing their best to protect their capital base are not weeping into their mugs with respect to their performance since 2010...but rather....rubbing their hands in glee in relation to a future event that is just 'waiting to happen'.
What I would like to point out however in this post is how the EDTT as a shorter term momentum technique stacks up against the performance results of a broader class of trend followers.
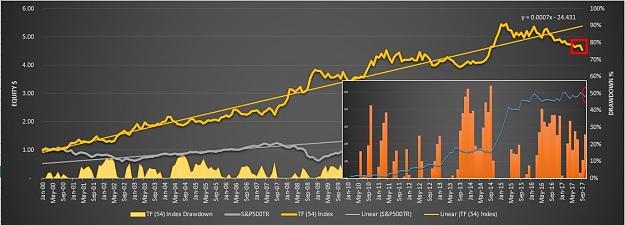
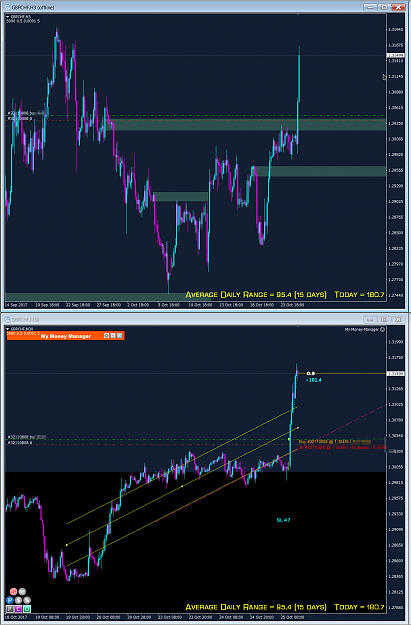
Have a close look at the chart above. I have aligned the EDTT results up to September 2017 with the performance results of the TF Index so we can compare and contrast performance in terms of their different equity curve profiles. You will note that as the diversified EDTT is a momentum trader with a similar performance profile the more general class of diversified trend following techniques, both equity curves reflect similar characteristics. Namely that strong performance growth in both the EDTT and trend following in general was observed during late 2014 to 2015 associated with more volatile times with the balance of the period since 2010 representing unfavorable market conditions for trend following in general.
However...I would like you now to focus on the differences between the equity curves of the TF Index and the EDTT. What you will note is that as opposed to going backwards, the EDTT managed to not only protect the capital base but also grow it's capital base over these difficult times. This augers very well for the long term robustness of the EDTT in handling unfavorable regimes for momentum and trend following in general.
The predominant reason that I attribute to this feature of the EDTT is it's very efficient nature in addressing momentum. Trend following in general is far less efficient than the EDTT as it allows room to breathe in relation to capturing long term trends. When these long term trends are absent, trend following as a class suffers building drawdowns attributed to this less efficient trading style.
So what do we mean by the term trade efficiency in the context of the EDTT? Trade efficiency has little to do with your entries and everything to do with your position sizing, trade management and exits. What trade management is about is how to deploy techniques to maximise the efficiency of the R:R relationship and the use of the SDC in the EDTT is the predominant reason for this improved performance against traditional trend following techniques. This is leading to 'the edge' that we frequently hear about.
What builds efficiencies with the EDTT are the following key factors:
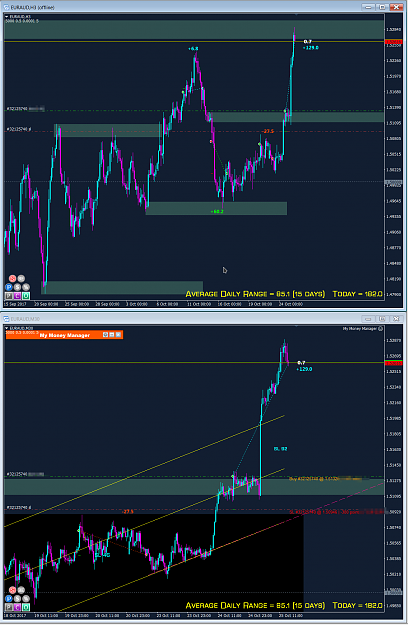
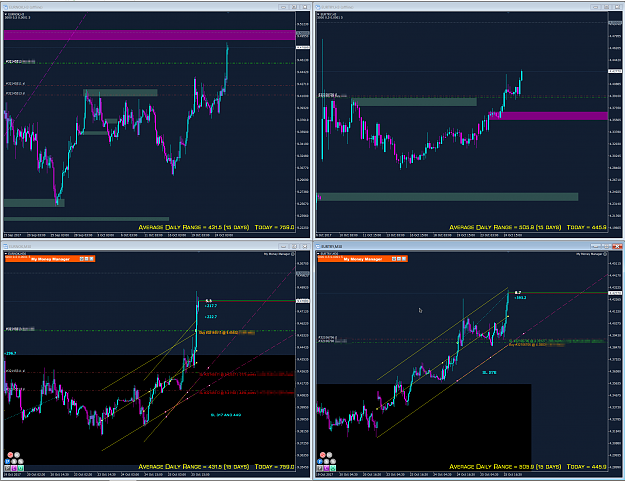
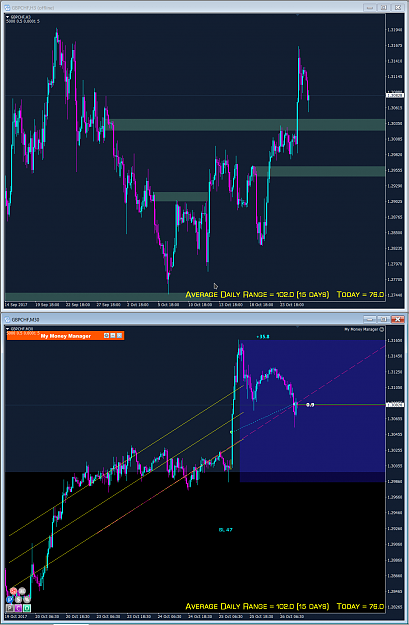
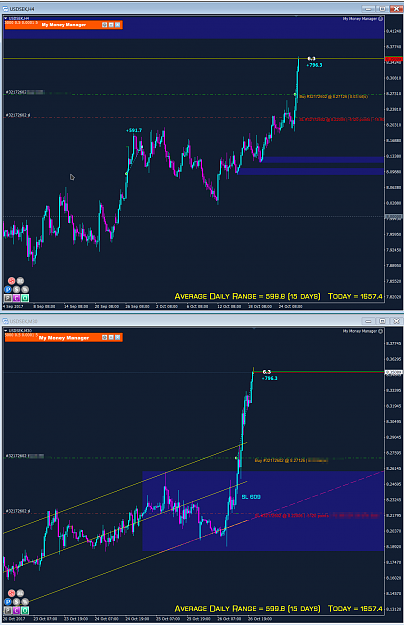
1. We are very selective about when we enter. Namely during those times when fat tails tend to rear their heads. We do not trade the normal day to day churn of the markets but only strike at the rarer outliers;
2. We define our initial stop, projected exits and position sizes in advance before we take the trade in response to most recent momentum. If we are wrong in our assessment that the recent characteristics of momentum will continue into the future, then we are out of the trade.....no ifs or buts;
3. We maximise our position sizing in accordance with recent momentum to strike hard when it continues;
4. We never take the full loss hit of our initial stop and always exit at a reduced loss;
5. We simply let profits run with a tight trailing stop when momentum continues on in our favour;
6. Being a discretionary system we manage our drawdowns and equity curve on a continuous basis simply pushing pending order entries further away as drawdown builds avoiding a continuance during unfavorable market conditions. Capital management under discretion is a very powerful weapon.
So we therefore have a rare breed of strategy that not only outperforms general trend following when conditions are in our favour....but we also have a class of strategy that outperforms general trend following when conditions are not in our favour. You can't ask for more than that.
Trade efficiently my friends and start taking capital management seriously.
Cheers
C
We have the results below up to September 2017 for the Professional Fund Managers who practice the shady art of Trend Following.
Attached Image (click to enlarge)
September was a further blow to the trend following community which simply continues the poor performance results since February 2017 where the slide in performance is now leading to historical max drawdowns of 16.94% for 54 of the top trend following funds who have been in operation from 1 Jan 2000 to current day.
The reason for this slide in performance can be attributed to central bank intervention which has led to broad scale investment in bonds and equities through the glut of printed money. For example since 2010 over 14 trillion dollars have been injected into the financial markets through quantitative easing. During 2017 approximately $1 Trillion or roughly $250 billion per month has been injected into the financial system....and it needs to find a home somewhere...which it has in US Treasury bonds and equities.
The chart below sums up this never ending mistake of propping up a faltering western economy.
Attached Image
So now that we understand the cause, we can then understand the symptoms. Here is the performance of the S&P500 total return index (including dividends) since intervention following the GFC. If you look hard you might be able to discern the impact of the GFC in 2008 that is now dwarfed by the bull run that is not founded in solid economic terms, but rather is a direct result of failed economic policy. To any sane human being with a dose of common sense, you can therefore understand that this is not sustainable and we are probably gaping into the jaws of a severe meltdown that is likely to shadow the intervened result of the GFC.
Attached Image (click to enlarge)
Now with this context as a backdrop, you can understand that the Commodity Trading Advisors (CTA's) represented as diversified trend followers have been having a historically hard time over the same period....as the performance results of the CTA's are un-correlated with the S&P500TR Index.
So in a nutshell....the trend following community while experiencing difficult times and simply doing their best to protect their capital base are not weeping into their mugs with respect to their performance since 2010...but rather....rubbing their hands in glee in relation to a future event that is just 'waiting to happen'.
What I would like to point out however in this post is how the EDTT as a shorter term momentum technique stacks up against the performance results of a broader class of trend followers.
Attached Image (click to enlarge)
Have a close look at the chart above. I have aligned the EDTT results up to September 2017 with the performance results of the TF Index so we can compare and contrast performance in terms of their different equity curve profiles. You will note that as the diversified EDTT is a momentum trader with a similar performance profile the more general class of diversified trend following techniques, both equity curves reflect similar characteristics. Namely that strong performance growth in both the EDTT and trend following in general was observed during late 2014 to 2015 associated with more volatile times with the balance of the period since 2010 representing unfavorable market conditions for trend following in general.
However...I would like you now to focus on the differences between the equity curves of the TF Index and the EDTT. What you will note is that as opposed to going backwards, the EDTT managed to not only protect the capital base but also grow it's capital base over these difficult times. This augers very well for the long term robustness of the EDTT in handling unfavorable regimes for momentum and trend following in general.
The predominant reason that I attribute to this feature of the EDTT is it's very efficient nature in addressing momentum. Trend following in general is far less efficient than the EDTT as it allows room to breathe in relation to capturing long term trends. When these long term trends are absent, trend following as a class suffers building drawdowns attributed to this less efficient trading style.
So what do we mean by the term trade efficiency in the context of the EDTT? Trade efficiency has little to do with your entries and everything to do with your position sizing, trade management and exits. What trade management is about is how to deploy techniques to maximise the efficiency of the R:R relationship and the use of the SDC in the EDTT is the predominant reason for this improved performance against traditional trend following techniques. This is leading to 'the edge' that we frequently hear about.
What builds efficiencies with the EDTT are the following key factors:
1. We are very selective about when we enter. Namely during those times when fat tails tend to rear their heads. We do not trade the normal day to day churn of the markets but only strike at the rarer outliers;
2. We define our initial stop, projected exits and position sizes in advance before we take the trade in response to most recent momentum. If we are wrong in our assessment that the recent characteristics of momentum will continue into the future, then we are out of the trade.....no ifs or buts;
3. We maximise our position sizing in accordance with recent momentum to strike hard when it continues;
4. We never take the full loss hit of our initial stop and always exit at a reduced loss;
5. We simply let profits run with a tight trailing stop when momentum continues on in our favour;
6. Being a discretionary system we manage our drawdowns and equity curve on a continuous basis simply pushing pending order entries further away as drawdown builds avoiding a continuance during unfavorable market conditions. Capital management under discretion is a very powerful weapon.
So we therefore have a rare breed of strategy that not only outperforms general trend following when conditions are in our favour....but we also have a class of strategy that outperforms general trend following when conditions are not in our favour. You can't ask for more than that.
Trade efficiently my friends and start taking capital management seriously.
Cheers
C
Inserted Video
3