• Home
  • Forums
  • Trades
  • News
  • Calendar
  • Market
  • Brokers
  • Login
  • Join
  • User/Email: Password:
  • 9:33am
Menu
  • Forums
  • Trades
  • News
  • Calendar
  • Market
  • Brokers
  • Login
  • Join
  • 9:33am
Sister Sites
  • Metals Mine
  • Energy EXCH
  • Crypto Craft

Options

Bookmark Thread

First Page First Unread Last Page Last Post

Print Thread

Similar Threads

Fast TMA indicator (which does NOT call itself!) 3 replies

Fast Backtester Indicator 0 replies

Fast Markets May Kill Our Accounts ? 0 replies

Anyone Know Where I Can Find FAST Free Real-Time News Results? 8 replies

Where to check free FAST update information? 2 replies

  • Platform Tech
  • /
  • Reply to Thread
  • Subscribe
  • 48
Attachments: Fast Markets Indicator
Exit Attachments

Fast Markets Indicator

  • Last Post
  •  
  • Page 1 23 4
  • Page 1 23 4
  •  
  • Post #1
  • Quote
  • First Post: Edited Oct 25, 2017 2:19pm Oct 21, 2017 2:48pm | Edited Oct 25, 2017 2:19pm
  •  Nicholishen
  • Joined Jul 2005 | Status: zzzzzzzzzzzzzzzzzzzzzzzzz zzzzzzzzzz | 1,289 Posts
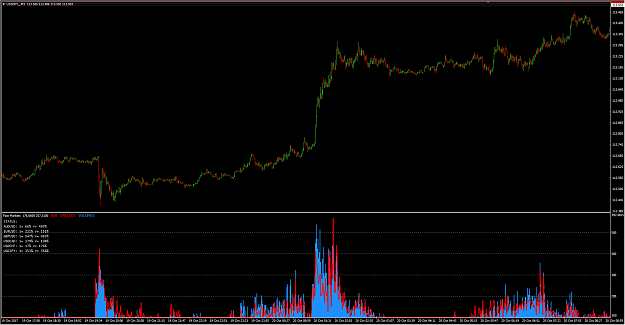
Are you in a fast-market or a just a fast run on your pair? Did country X just threaten war on country Y (and you don't know it yet) or is a market-maker just pulling a fast one? Are the markets making a major trending move? Are they vigorously consolidating? These are the questions this indicator aims to answer to save you decision-making-time and pips.

The idea behind this indicator: a fast run on a pair will only effect a few pairs (most one major and minor crosses) and can be determined by low volume and lack of movement on the other majors. Conversely, a major market event will increase volume and movement across all of the majors.

This indicator measures the average current volume and bar-spreads (high minus low) of all majors (M1 ideal) and compares the current volume to a n-period MA of volume and the average percent of spread to ATR. Whew... that's a lot of averages... To simplify it all, you are only seeing large spikes when vigorous market activity is detected in all the majors all at once.

This only works with ECN brokers with very active tick-data feeds. Do not use this with a fixed spread market maker and expect any meaningful results. The reason you will not get proper results is because MM brokers only update the tick when price has moved within a certain deviationof the wide spreads. If you trade with a MM and want to use this then I'd recommend downloading a demo from an ECN that provides an active feed.

How to interpret the results:

Assuming you are using an active feed, when you see the volume spike up while the spreads remain relatively low then this is signaling a highly active consolidating market. Spreads that spike up past volume can indicate a super fast moving market or a quickly gaping price on one of the majors. To the right of the indicator you will see zones marked 200+, this represent the percentage the market is currently trading at compared to the recent past. For example a spike to 400 means that current spreads and volume are 400% higher than the average of the past n-periods. It's important to understand that this indicator measures the rate of change in market dynamics. You could very well be in a very strong trending market with a lot of volume and the indicator shows no reading, this is because the market is currently 'business as usual'.

Attached Image (click to enlarge)
Click to Enlarge

Name: fastmarkets.png
Size: 71 KB


Older prototype on USDCAD release.
Inserted Video


UPDATE 2017.10.25: Major update (FastMarkets2)

  1. Makes index from all individual pairs that contain currencies form the chart pair. For example: GBPUSD on chart = index comprised of GBPJPY, GBPUSD, GBPCHF...and so on.
  2. Alerts added with tuning options.
  3. Symbols sorted in real-time by most active

UPDATE 2017.10.25: Minor update (FastMarkets2.2)

  1. Added button to toggle audible alerts.
  2. Fixed minor bug with alerts not sounding on spread gapping

Attached Files
File Type: mq4 FastMarkets.mq4   12 KB | 913 downloads
File Type: ex4 FastMarkets2.2.ex4   55 KB | 756 downloads | Uploaded Oct 25, 2017 2:17pm
File Type: rar FastMarkets.rar   225 KB | 780 downloads | Uploaded Oct 25, 2017 2:18pm
  • Post #2
  • Quote
  • Oct 21, 2017 7:24pm Oct 21, 2017 7:24pm
  •  mambomango
  • Joined Apr 2016 | Status: Member | 175 Posts
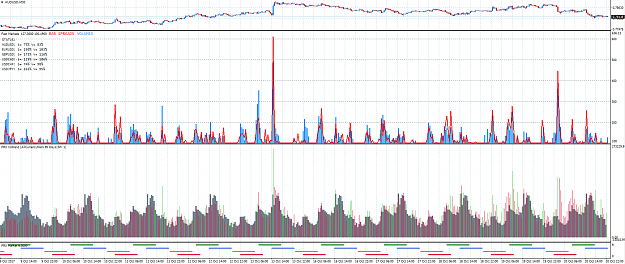
good idea but did you considered the time of day?
the gray bars in my experimental indi represents the average volume over all pairs on every single time of the day 90 days back.
so lets say the 6:30pm-bar on the 30M chart, the gray bar is the average volume of the last 90 6:30pm-bars over all 28 pairs. the colored bar is the actual average volume of all pairs.
the bottom indi is just a session indi starting with the london session in green, blue is new york.
there you can see that volume spikes are time of day related.
Attached Image (click to enlarge)
Click to Enlarge

Name: marketv.PNG
Size: 104 KB
 
 
  • Post #3
  • Quote
  • Oct 21, 2017 7:39pm Oct 21, 2017 7:39pm
  •  leeshindig
  • Joined Apr 2007 | Status: Member | 317 Posts
What a really really good idea!!.. I will use this for sure. Quick question.. would it be possible to add a pop up and sound alert when it passes a level set by the user?
For instance, say I wanted to be alerted when the blue bars cross up above the 150 or 200 level? If not, thanks again for a really interesting indicator.
 
 
  • Post #4
  • Quote
  • Edited at 8:38pm Oct 21, 2017 7:52pm | Edited at 8:38pm
  •  Nicholishen
  • Joined Jul 2005 | Status: zzzzzzzzzzzzzzzzzzzzzzzzz zzzzzzzzzz | 1,289 Posts
Quoting mambomango
Disliked
good idea but did you considered the time of day? the gray bars in my experimental indi represents the average volume over all pairs on every single time of the day 90 days back. so lets say the 6:30pm-bar on the 30M chart, the gray bar is the average volume of the last 90 6:30pm-bars over all 28 pairs. the colored bar is the actual average volume of all pairs. the bottom indi is just a session indi starting with the london session in green, blue is new york. there you can see that volume spikes are time of day related. {image}
Ignored
Yes this considers volume at any time of the day, and it's specifically designed to be used on M1 or M5. It works by taking the MA of volume (60 period/minute) for each individual pair then calculates a percentage of that pair's current bar volume to the MA of volume. Next, it averages all of those volume factors from each major to create an overall averaged market volume index. The same goes for spreads but using the ATR(60). So we are constantly monitoring the volumes and spreads on six major currency pairs at all times. The goal has nothing to do with comparing volumes to different sessions, etc... I'm not interest in the volume across many days or any specific time of day, and I'm only interested in detecting rapid increases to volatility across all majors on low time-frames.

In summary, this indicator is designed to alert the trader to rapid changes in total market volatility and nothing more. You're comparing apples and oranges since both of our indicators have different goals in mind.
 
 
  • Post #5
  • Quote
  • Oct 21, 2017 7:56pm Oct 21, 2017 7:56pm
  •  Nicholishen
  • Joined Jul 2005 | Status: zzzzzzzzzzzzzzzzzzzzzzzzz zzzzzzzzzz | 1,289 Posts
Quoting leeshindig
Disliked
What a really really good idea!!.. I will use this for sure. Quick question.. would it be possible to add a pop up and sound alert when it passes a level set by the user? For instance, say I wanted to be alerted when the blue bars cross up above the 150 or 200 level? If not, thanks again for a really interesting indicator.
Ignored
That's coming, but first I wanted to nail down the essentials.
 
 
  • Post #6
  • Quote
  • Oct 21, 2017 11:08pm Oct 21, 2017 11:08pm
  •  OHLC
  • | Joined Oct 2017 | Status: Member | 498 Posts
Awesome indicator. Is there a way to change the MA period?
Here's Tom with the weather.
 
 
  • Post #7
  • Quote
  • Edited Oct 22, 2017 12:03am Oct 21, 2017 11:52pm | Edited Oct 22, 2017 12:03am
  •  mambomango
  • Joined Apr 2016 | Status: Member | 175 Posts
Quoting Nicholishen
Disliked
{quote} Yes this considers volume at any time of the day, and it's specifically designed to be used on M1 or M5. It works by taking the MA of volume (60 period/minute) for each individual pair then calculates a percentage of that pair's current bar volume to the MA of volume. Next, it averages all of those volume factors from each major to create an overall averaged market volume index. The same goes for spreads but using the ATR(60). So we are constantly monitoring the volumes and spreads on six major currency pairs at all times. The goal has nothing...
Ignored
i got your point just want to show you that the spike could be a very normal increase in volume like it happens every day at the time even without general news times.
the question is how important is a session based volume increase.
i played soo much with tick volume and couldnt find anything that gives you an edge, would be interesting if you can find a use for tick volume.
for me its like an increase from i.e. 10 buyers and 5 sellers to 100 buyers and 50 sellers, the equilibrium is the same.
 
 
  • Post #8
  • Quote
  • Edited at 3:05am Oct 22, 2017 12:37am | Edited at 3:05am
  •  Nicholishen
  • Joined Jul 2005 | Status: zzzzzzzzzzzzzzzzzzzzzzzzz zzzzzzzzzz | 1,289 Posts
Quoting mambomango
Disliked
{quote} i got your point just want to show you that the spike could be a very normal increase in volume like it happens every day at the time even without general news times. the question is how important is a session based volume increase. i played soo much with tick volume and couldnt find anything that gives you an edge, would be interesting if you can find a use for tick volume. for me its like an increase from i.e. 10 buyers and 5 sellers to 100 buyers and 50 sellers, the equilibrium is the same.
Ignored
I see your point, but this really needs to be used with some common sense like knowing when tick volumes normally increase and when timed news releases are scheduled.
 
1
  • Post #9
  • Quote
  • Oct 22, 2017 3:07am Oct 22, 2017 3:07am
  •  Trader-Waldo
  • | Membership Revoked | Joined Sep 2017 | 422 Posts
buying and selling climax in Better Volume 1.4 indicator shows similar.
NO MATTER THE SITUATION,NEVER LET YOUR EMOTIONS OVERPOWER YOUR INTELLIGENCE
 
 
  • Post #10
  • Quote
  • Oct 22, 2017 11:13am Oct 22, 2017 11:13am
  •  Nicholishen
  • Joined Jul 2005 | Status: zzzzzzzzzzzzzzzzzzzzzzzzz zzzzzzzzzz | 1,289 Posts
Quoting Trader-Waldo
Disliked
buying and selling climax in Better Volume 1.4 indicator shows similar.
Ignored
All volume indicators will go up when this goes up, but not all volume indicators go down when this goes down. The point is to cut out the noise and filter out the market signals that really matter.
 
 
  • Post #11
  • Quote
  • Oct 22, 2017 1:48pm Oct 22, 2017 1:48pm
  •  OHLC
  • | Joined Oct 2017 | Status: Member | 498 Posts
Quoting Nicholishen
Disliked
...and compares the current volume to a n-period MA of volume and the average percent of spread to ATR...
Ignored
I see so it's not really meant to have an adjustable parameter for the MA period.
Here's Tom with the weather.
 
 
  • Post #12
  • Quote
  • Oct 22, 2017 2:06pm Oct 22, 2017 2:06pm
  •  Nicholishen
  • Joined Jul 2005 | Status: zzzzzzzzzzzzzzzzzzzzzzzzz zzzzzzzzzz | 1,289 Posts
Quoting OHLC
Disliked
{quote} I see so it's not really meant to have an adjustable parameter for the MA period.
Ignored
Nah... I hard coded it to automatically change based on time-frame because there are a lot of holy-grail indicator junkies that have a tendency to get wildly creative and I wanted to get feedback based on consistent params, but for you, I'll make an exception.
Attached File
File Type: mq4 FastMarkets_1.21.mq4   12 KB | 477 downloads
 
2
  • Post #13
  • Quote
  • Edited at 8:52am Oct 23, 2017 8:22am | Edited at 8:52am
  •  sakisf
  • Joined Sep 2013 | Status: boreddddd | 3,135 Posts
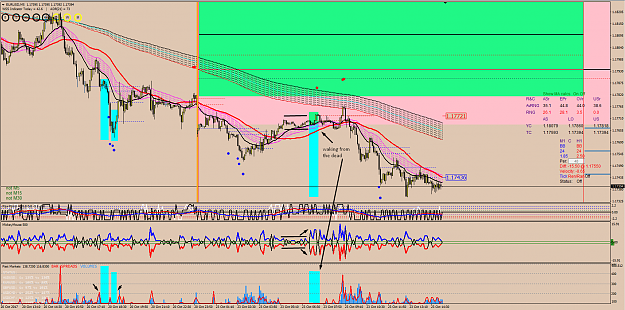
We are very close here. Only I noticed that when Vol is low yours will cut off some significant action.
Attached Image (click to enlarge)
Click to Enlarge

Name: lcO9oj6iT3az3_3YFSuqWw.png
Size: 137 KB
Perhaps you could join the 2 and make something else out of it.
Attached File
File Type: mq4 aMickeyMouse.mq4   6 KB | 442 downloads
 
1
  • Post #14
  • Quote
  • Oct 23, 2017 6:06pm Oct 23, 2017 6:06pm
  •  Nicholishen
  • Joined Jul 2005 | Status: zzzzzzzzzzzzzzzzzzzzzzzzz zzzzzzzzzz | 1,289 Posts
Quoting sakisf
Disliked
We are very close here. Only I noticed that when Vol is low yours will cut off some significant action. {image}Perhaps you could join the 2 and make something else out of it. {file}
Ignored
Hey, I appreciate the feedback and the sauce to your indi, right on. The reason this didn't show any activity is because it worked as designed. The Fast markets indicator should only sound the alarm bells when increase volatility (beyond the mean) is detected in all majors. In this case EU moved a little but everything else was relatively calm.
 
1
  • Post #15
  • Quote
  • Oct 23, 2017 9:30pm Oct 23, 2017 9:30pm
  •  VEEFX
  • Joined Jun 2006 | Status: Adios! | 3,377 Posts
Quoting Nicholishen
Disliked
Are you in a fast-market or a just a fast run on your pair? Did country X just threaten war on country Y (and you don't know it yet) or is a market-maker just pulling a fast one? Are the markets making a major trending move? Are they vigorously consolidating? These are the questions this indicator aims to answer to save you decision-making-time and pips. The idea behind this indicator: a fast run on a pair will only effect a few pairs (most one major and minor crosses) and can be determined by low volume and lack of movement on the other majors....
Ignored
Good Job Nicholishen. It's remarkable how smart developers like yourself are unselfishly willing to share their code. Kudos bro.

If i could bother you with couple of questions:

1) I am curious how would you compare your "FX Volatility Index" indicator with the calculations behind the VIX indicator for stock market?

2) How can I use this indicator as a volatility index for just one currency i.e. USD volatility index, EUR volatility index etc

3) Here's a practical integration of your indicator with my EA that I can relate to. I love time duration based stops...meaning if an entry becomes stagnant for x minutes, it a bad entry and it is better to GTFO and exit the trade. But this protocol works well (only?) with momentum based entries. My EA lacks this element for force but most likely the force will happen within the next 4 hours of the H4 TF entry. As signal can occur at time of any day across 28 pairs, once I get an entry signal (say at the open of H4 candle) determining direction of trend trade, Can I call your indicator as icustom() or a function call to enter a looping wait state, wait for volatility to go above xxx% and then take the trade?
If you are not getting my 'hidden' motive behind this, I am trying to optimize the use of margin by eliminating these stale trades that go nowhere for a while choking my precious resource I.e. available margin! I will feed the direction and your indicator will time the trade at the NEXT desired volatility level if it meets my max_spread value :-) Is this doable? My risk per trade is 0.25% so literally I can take 2-3 attempts on a H4 candle if I have to. It's like HFT approach to long term position and trend following system :-)
Staying in my lane...
 
2
  • Post #16
  • Quote
  • Oct 24, 2017 2:04am Oct 24, 2017 2:04am
  •  sakisf
  • Joined Sep 2013 | Status: boreddddd | 3,135 Posts
Quoting Nicholishen
Disliked
{quote} Hey, I appreciate the feedback and the sauce to your indi, right on. The reason this didn't show any activity is because it worked as designed. The Fast markets indicator should only sound the alarm bells when increase volatility (beyond the mean) is detected in all majors. In this case EU moved a little but everything else was relatively calm.
Ignored
Yeah, missed the part about all majors in the first post. Will try to also include it in mine to see if we are getting a match.
 
 
  • Post #17
  • Quote
  • Oct 24, 2017 12:09pm Oct 24, 2017 12:09pm
  •  Nicholishen
  • Joined Jul 2005 | Status: zzzzzzzzzzzzzzzzzzzzzzzzz zzzzzzzzzz | 1,289 Posts
Quoting VEEFX
Disliked
{quote} Good Job Nicholishen. It's remarkable how smart developers like yourself are unselfishly willing to share their code. Kudos bro. If i could bother you with couple of questions: 1) I am curious how would you compare your "FX Volatility Index" indicator with the calculations behind the VIX indicator for stock market? 2) How can I use this indicator as a volatility index for just one currency i.e. USD volatility index, EUR volatility index etc 3) Here's a practical integration of your indicator with my EA that I can relate to. I love time duration...
Ignored
1. VIX is a measure of expected volatility, and these have nothing in common from the algorithm side of things.
2. It would be possible but it would take a lot of work to recode it... In the mean-time you can try my relative currency strength indicator... you may find it well suited to your needs.
3. I don't see why you couldn't, however, there's no way to backtest it. Also, I've noticed some minor bugs with this drawing the history before all data gets updated across the other pairs... If it were my EA, and I do plan on using this or something like it, I would hard code the logic into the EA instead of calling iCustom.
Attached Files
File Type: rar RCS.rar   8 KB | 352 downloads
File Type: ex4 Relative_Currency_Strength.ex4   41 KB | 471 downloads
 
 
  • Post #18
  • Quote
  • Oct 24, 2017 1:19pm Oct 24, 2017 1:19pm
  •  VEEFX
  • Joined Jun 2006 | Status: Adios! | 3,377 Posts
Quoting Nicholishen
Disliked
{quote} 1. VIX is a measure of expected volatility, and these have nothing in common from the algorithm side of things. 2. It would be possible but it would take a lot of work to recode it... In the mean-time you can try my relative currency strength indicator... you may find it well suited to your needs. 3. I don't see why you couldn't, however, there's no way to backtest it. Also, I've noticed some minor bugs with this drawing the history before all data gets updated across...
Ignored
Thanks man. I don't believe in indicator based relative currency strength for entries. I have a better approach to strategically place positions and then hopefully use currency strength as a push to move my positions into profitability. As I said in my previous posts, i don't force the outcome on me, i prepare and plan for the intended and desired outcome :-)

Regarding "If it were my EA, and I do plan on using this or something like it, I would hard code the logic into the EA instead of calling iCustom.", i agree. I am just tired of coding ,afraid of distractions and fear running into new discoveries that might take my focus away from my journey :-)
certainly something to add to my research bucket (unless you are feeling generous to strip your indicator into function that i can call from my EA) :-)
Staying in my lane...
 
 
  • Post #19
  • Quote
  • Oct 24, 2017 2:36pm Oct 24, 2017 2:36pm
  •  zwara
  • Joined Jun 2015 | Status: Member | 400 Posts
Quoting mambomango
Disliked
good idea but did you considered the time of day? the gray bars in my experimental indi represents the average volume over all pairs on every single time of the day 90 days back. so lets say the 6:30pm-bar on the 30M chart, the gray bar is the average volume of the last 90 6:30pm-bars over all 28 pairs. the colored bar is the actual average volume of all pairs. the bottom indi is just a session indi starting with the london session in green, blue is new york. there you can see that volume spikes are time of day related. {image}
Ignored

Hello Nicholishen, and all the people reading the thread, first of all I should thank you for your efforts and for this tool, volume is a very important tool in my trading plan, so I will always give my feedback and try to help with my limited very limited incite.

Now in regards with Mambo's post, he has a little bit of reasoning in what is he saying, there are some specific times of the day where the majority of the brokers will at some extend manipulate the feed on volume I already spoted two of those specific times and those are 8am GMT there will always be a spike on volume in all majors but in 80% of the cases if not more that volume has to be ignored because it's london open and the ticks jump all over without any reason behind it, also historically between 23.30 and 23.59 there will always be a 5 min candle very small normally that accumulates a lot of volume compared with the 10/20 previous ones, still the market ignores that volume. I already observed this behaviour several times where price will just tick 0.1 up and down and remain in there doing that behaviour for a minute or two. The reason why I am point this out is because it happens in all majors and normally the spread of the candles is relatively small.
Now the question is :
1 - will that some how influence the information your indy presents?

2 - sorry for this question I might have missed something ( I can be quite dumb sometimes ), can it be applied to work only with some specific pairs for example all GBP based pairs or only EUR specific pairs?

Again thanks for the thread I will keep this one under watch because like I said the more I can understand about volume the better for me.

Stay safe
Zwara.
 
 
  • Post #20
  • Quote
  • Oct 24, 2017 3:33pm Oct 24, 2017 3:33pm
  •  Nicholishen
  • Joined Jul 2005 | Status: zzzzzzzzzzzzzzzzzzzzzzzzz zzzzzzzzzz | 1,289 Posts
Quoting zwara
Disliked
{quote} Hello Nicholishen, and all the people reading the thread, first of all I should thank you for your efforts and for this tool, volume is a very important tool in my trading plan, so I will always give my feedback and try to help with my limited very limited incite. Now in regards with Mambo's post, he has a little bit of reasoning in what is he saying, there are some specific times of the day where the majority of the brokers will at some extend manipulate the feed on volume I already spoted two of those specific times and those are 8am GMT...
Ignored
Hi zwara,

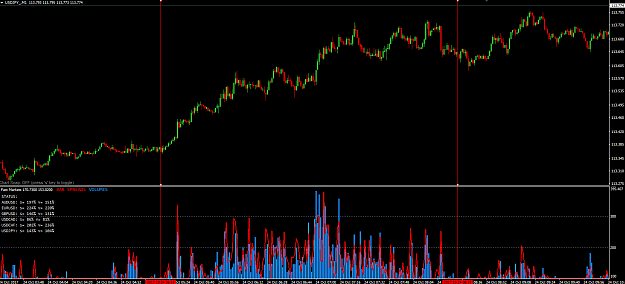
Like I mentioned in the OP, this indicator has a very specific use case, which is determining when the (average) activity on the majors has increased beyond the (average) moving average of activity. As stated in the OP this only works with good ECN brokers. A good ECN broker passes through all the ticks from the LPs. If you're seeing very large spikes at the same times/sessions then that should tip you off that that your broker is doing some funny business. Here is a screenshot from 8GMT which you can see from my broker that the market was already wide-awake and already very active.
Attached Image (click to enlarge)
Click to Enlarge

Name: 8gmt.png
Size: 74 KB


Here is really what this indicator was intended for... detecting unexpected events like today.
Attached Image (click to enlarge)
Click to Enlarge

Name: offthecharts.png
Size: 48 KB
 
 
  • Platform Tech
  • /
  • Fast Markets Indicator
  • Reply to Thread
    • Page 1 23 4
    • Page 1 23 4
0 traders viewing now
  • More
Top of Page
  • Facebook
  • Twitter
About FF
  • Mission
  • Products
  • User Guide
  • Media Kit
  • Blog
  • Contact
FF Products
  • Forums
  • Trades
  • Calendar
  • News
  • Market
  • Brokers
  • Trade Explorer
FF Website
  • Homepage
  • Search
  • Members
  • Report a Bug
Follow FF
  • Facebook
  • Twitter

FF Sister Sites:

  • Metals Mine
  • Energy EXCH
  • Crypto Craft

Forex Factory® is a brand of Fair Economy, Inc.

Terms of Service / ©2022