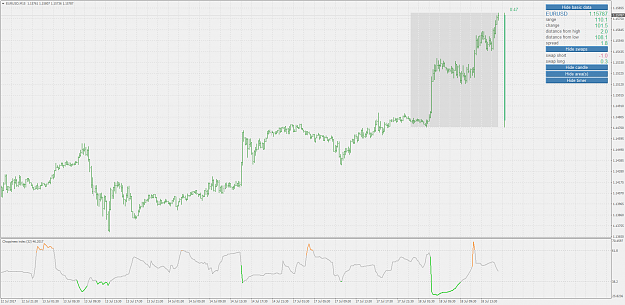
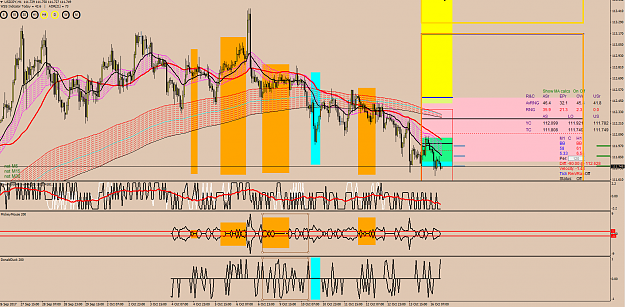
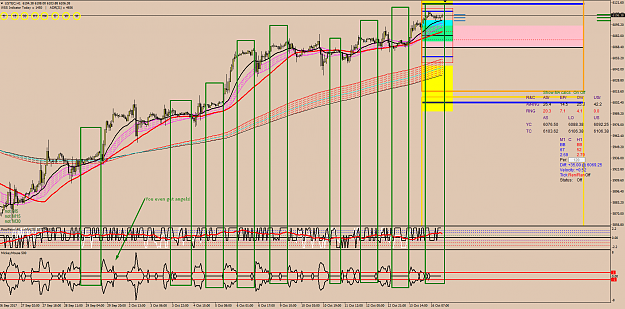
• Home
  • Forums
  • Trades
  • News
  • Calendar
  • Market
  • Brokers
  • Login
  • Join
  • User/Email: Password:
  • 6:14am
Menu
  • Forums
  • Trades
  • News
  • Calendar
  • Market
  • Brokers
  • Login
  • Join
  • 6:14am
Sister Sites
  • Metals Mine
  • Energy EXCH
  • Crypto Craft

Options

Bookmark Thread

First Page First Unread Last Page Last Post

Print Thread

Similar Threads

Any indicator that tells when Choppy/Ranging starts/ends? 20 replies

Anyone got any good concentration tips/ideas/strategies 7 replies

VennD - Any Pairs - Any Style - Any Time 740 replies

choppy choppy choppy! 21 replies

Any Ideas on good charts, free too expensive 6 replies

  • Trading Discussion
  • /
  • Reply to Thread
  • Subscribe
  • 77
Attachments: Choppy market index: any good ideas?
Exit Attachments

Choppy market index: any good ideas?

  • Last Post
  •  
  • 1 34Page 567 8
  • 1 4Page 56 8
  •  
  • Post #81
  • Quote
  • Oct 13, 2017 3:06pm Oct 13, 2017 3:06pm
  •  OHLC
  • | Joined Oct 2017 | Status: Member | 498 Posts
Quoting PipMeUp
Disliked
{quote} I don't get your point. The red "oscillator" is the ratio LONG/(LONG+SHORT). I added the black arrows manually exactly to show what you say: it mirrors the trend. The more the price raises the higher the proportion of short positions and the other way around. I'm simply proposing a plausible explanation to this: people let their losers run and close quickly the profitable trades.
Ignored
Isn't the higher proportion of short positions in a rising market due to the "non-commercials" market participants? It's been a long time since I've read about COT reports.
Here's Tom with the weather.
 
 
  • Post #82
  • Quote
  • Oct 13, 2017 4:11pm Oct 13, 2017 4:11pm
  •  RondaRousey
  • Joined Jan 2017 | Status: Member | 695 Posts
Quoting PipMeUp
Disliked
{quote} Absolutely. I cherry picked EUR/USD because it is the most traded pair. I cherry picked daily to have all the year 2017. I cherry picked the last price action because I was unable to cherry pick the future... The TF you trade is irrelevant. The exposure is sampled at 30min resolution.
Ignored
A number of things you wrote I have issues with if you want to trade profitably. Can a mathematician crack a high security safe? If you want to crack the safe to profitable trading think like a safe cracker.

You are a mathematician more than a trader.

My 2 cents

add me to your ignore list
You came here for the truth and let me unveil it for you
 
 
  • Post #83
  • Quote
  • Oct 13, 2017 5:37pm Oct 13, 2017 5:37pm
  •  The-Flipper
  • Joined Aug 2015 | Status: Member | 429 Posts
When i check and stare at my screen, i immediately can see if the market is bullsh*tting around.
It's one of the easiest things to tell.
 
1
  • Post #84
  • Quote
  • Oct 13, 2017 7:36pm Oct 13, 2017 7:36pm
  •  sakisf
  • Joined Sep 2013 | Status: boreddddd | 3,135 Posts
Blue = trend, red = range/choppiness/change of direction/bs. When there's divergence between black & white, something (nothing) is about to happen. If only it could predict the future
Attached Images (click to enlarge)
Click to Enlarge

Name: oqPjegnLRk6ED3cHrXTrqg.png
Size: 93 KB Click to Enlarge

Name: kkhnssV0RFyIpp2bBjmYlA.png
Size: 83 KB Click to Enlarge

Name: 7U1U-to3TjyKL1zqbKadGQ.png
Size: 153 KB
 
 
  • Post #85
  • Quote
  • Oct 13, 2017 7:58pm Oct 13, 2017 7:58pm
  •  sakisf
  • Joined Sep 2013 | Status: boreddddd | 3,135 Posts
Easier on a renko/range chart
Attached Images (click to enlarge)
Click to Enlarge

Name: u2eHQ0LAQS2tRJV76i8eGw.png
Size: 167 KB Click to Enlarge

Name: KzuxGIPaS96Vy0htCxl1Zg.png
Size: 156 KB
 
2
  • Post #86
  • Quote
  • Oct 16, 2017 4:50am Oct 16, 2017 4:50am
  •  PipMeUp
  • Joined Aug 2011 | Status: Member | 1,305 Posts
Business as usual in FF... this thread has drifted into outer space.

- The interesting discussion about retailers positionning should go in its own thread.
- The goal is to estimate the choppiness/roughness on a given chart irregardless it is M15, daily, range bar or renko.
- Requests for multi-timeframe indicator belongs somewhere in Platform Tech.
- The choppiness/roughness can be spotted both in range and trend therefore it is not a matter of classifying the market as trending vs ranging.
- This estimation shall be done quantitatively. It is not about what people can see.
No greed. No fear. Just maths.
 
3
  • Post #87
  • Quote
  • Oct 16, 2017 5:32am Oct 16, 2017 5:32am
  •  heispark
  • Joined Apr 2011 | Status: Hoc Etiam Transibit.... | 4,998 Posts
Choppiness Index made by Mladen.
Try if you like it. I like it very much....
Attached Image (click to enlarge)
Click to Enlarge

Name: chop index.png
Size: 111 KB

https://www.forex-station.com/viewto...58#p1295360258
https://www.forex-station.com/viewto...44#p1295360344
https://www.forex-station.com/viewto...55#p1295361355
Attached File
File Type: mq4 choppiness index.mq4   4 KB | 468 downloads

Inserted Video
Simplicity is the ultimate sophistication - Leonardo da Vinci
 
3
  • Post #88
  • Quote
  • Oct 16, 2017 6:19am Oct 16, 2017 6:19am
  •  PipMeUp
  • Joined Aug 2011 | Status: Member | 1,305 Posts
Thanks for these links. Unfortunately the text says: "higher values equal more choppiness, while lower values indicate directional trending." This indicator seems again to discrimitate range vs trend. The screenshots also don't match what I'm looking at.
No greed. No fear. Just maths.
 
1
  • Post #89
  • Quote
  • Edited at 8:33am Oct 16, 2017 8:04am | Edited at 8:33am
  •  sakisf
  • Joined Sep 2013 | Status: boreddddd | 3,135 Posts
Maybe this could be more helpful?
Attached Images (click to enlarge)
Click to Enlarge

Name: sjMVL6ThSV6Qdwc8D9rd9Q.png
Size: 133 KB Click to Enlarge

Name: B0b7yZdgQQG3Z-_2_msw-w.png
Size: 127 KB Click to Enlarge

Name: tVHkteDMTEKGr_-rUkYp7g.png
Size: 152 KB Click to Enlarge

Name: btQGg7m_TWi79E4KNtpW0A.png
Size: 144 KB
 
1
  • Post #90
  • Quote
  • Oct 16, 2017 12:05pm Oct 16, 2017 12:05pm
  •  PipMeUp
  • Joined Aug 2011 | Status: Member | 1,305 Posts
Quoting sakisf
Disliked
Maybe this could be more helpful? {image} {image} {image} {image}
Ignored
The MickeyMouse indicator looks like what I'm looking for. Where can I read about the algorithm?
No greed. No fear. Just maths.
 
 
  • Post #91
  • Quote
  • Oct 16, 2017 1:52pm Oct 16, 2017 1:52pm
  •  sakisf
  • Joined Sep 2013 | Status: boreddddd | 3,135 Posts
Quoting PipMeUp
Disliked
{quote} The MickeyMouse indicator looks like what I'm looking for. Where can I read about the algorithm?
Ignored
It's not exactly an algo or mathematics. Just candle reading.
 
 
  • Post #92
  • Quote
  • Oct 16, 2017 6:19pm Oct 16, 2017 6:19pm
  •  Nicholishen
  • Joined Jul 2005 | Status: zzzzzzzzzzzzzzzzzzzzzzzzz zzzzzzzzzz | 1,289 Posts
I think I may have an idea of how to quantify chopiness using the correlation coefficient of ring pairs. In terms of chop (sideways market) the most extreme condition would be a completely flat price; never changing despite volatile conditions elsewhere in the market. Assuming a perfectly efficient market (it's close now due to HFT arbitrageurs), currency A/B would remain completely flat given C/A and C/B have a correlation of 1.

Taking UJ for example, without even looking at it we know it's experiencing chop when EU and EJ are highly correlated.

For those who don't know what "rings" are, it is any combination of currency-pairs where each individual currency is represented exactly twice. eg. EU,EJ,UJ or GU,EU,EG
 
 
  • Post #93
  • Quote
  • Oct 16, 2017 7:26pm Oct 16, 2017 7:26pm
  •  mambomango
  • Joined Apr 2016 | Status: Member | 175 Posts
Quoting Nicholishen
Disliked
Taking UJ for example, without even looking at it we know it's experiencing chop when EU and EJ are highly correlated.
Ignored
when EU and EJ are correlated you dont know if the E moves EU and EJ or a strong moving U and J. look at the other E pairs then you know if E is the mover or not.
if only EU and EJ are correlated but not EA,EG,ECAD... means that U and J move in the same direction with the same power so you see a flat line on UJ and you know that E has no power when the other E pairs are uncorrelated.
when you want to measure the choppiness of UJ, the UJ chart is enough it shows you the exact result of the combined U and J movement.
the word volatile is very good.
look what happens when U (blue) AND J (red) are flat. the probability of a choppy UJ increases. creating a formula should be easy to measure the flatness.
Attached Image (click to enlarge)
Click to Enlarge

Name: ujfl.PNG
Size: 50 KB
 
1
  • Post #94
  • Quote
  • Oct 16, 2017 7:49pm Oct 16, 2017 7:49pm
  •  Nicholishen
  • Joined Jul 2005 | Status: zzzzzzzzzzzzzzzzzzzzzzzzz zzzzzzzzzz | 1,289 Posts
Quoting mambomango
Disliked
{quote} when EU and EJ are correlated you dont know if the E moves EU and EJ or a strong moving U and J. look at the other E pairs then you know if E is the mover or not. if only EU and EJ are correlated but not EA,EG,ECAD... means that U and J move in the same direction with the same power so you see a flat line on UJ and you know that E has no power when the other E pairs are uncorrelated. when you want to measure the choppiness of UJ, the UJ chart is enough it shows you the exact result of the combined U and J movement. the word volatile is very...
Ignored
Mathematically speaking, if EU and EJ are perfectly correlated then UJ has to be flat, and it doesn't matter how the other EUR pairs are trading. Therefore, the higher the correlation coefficient on related ring pairs, the more flat and choppy the pair is. This could be extended to more rings than one and an index could consist of the average correlation of it rings.

1 = (A/B)(B/C)(C/A)
Attached File
File Type: xlsx Flat Correlation example.xlsx   10 KB | 131 downloads
 
 
  • Post #95
  • Quote
  • Edited at 8:53pm Oct 16, 2017 8:27pm | Edited at 8:53pm
  •  mambomango
  • Joined Apr 2016 | Status: Member | 175 Posts
Quoting Nicholishen
Disliked
{quote} Mathematically speaking, if EU and EJ are perfectly correlated then UJ has to be flat, and it doesn't matter how the other EUR pairs are trading. Therefore, the higher the correlation coefficient on related ring pairs, the more flat and choppy the pair is. This could be extended to more rings than one and an index could consist of the average correlation of it rings. 1 = (A/B)(B/C)(C/A) {file}
Ignored
indeed no question, what i wanted to tell you is that you can measure the UJ coppiness by looking at the UJ chart and you dont know what curreny moves the pairs you just see the result but not who was responsible for it. the result of all the ring pair calculations would be the UJ chart + formula for calculating flatness so you can use the UJ chart instead right?
i think its very important to find out who is choppy. look at my picture.
i cant see the benifit of calculating the UJ chart over ring correlation. its more a prove that you cant measure anything with one pair chart (when you think about it you may come the the conclusion that 99.999% here is bullsh...).
 
 
  • Post #96
  • Quote
  • Oct 16, 2017 9:05pm Oct 16, 2017 9:05pm
  •  Nicholishen
  • Joined Jul 2005 | Status: zzzzzzzzzzzzzzzzzzzzzzzzz zzzzzzzzzz | 1,289 Posts
Quoting mambomango
Disliked
{quote} indeed no question, what i wanted to tell you is that you can measure the UJ coppiness by looking at the UJ chart and you dont know what curreny moves the pairs you just see the result but not who was responsible for it. the result of all the ring pair calculations would be the UJ chart + formula for calculating flatness so you can use the UJ chart instead right? i think its very important to find out who is choppy. look at my picture. i cant see the benifit of calculating the UJ chart over ring correlation. its more a prove that you cant...
Ignored
The question was how to quantify choppiness. You can easily look at a chart a tell that it's choppy. Easy. Done. But how do you quantify it? Is it 0% chop or 100% or somewhere in-between? Also, why is it choppy? Is the entire market dead or are there other factors at play? Simply measuring up and down bars (unfortunately) won't give you those answers.
 
 
  • Post #97
  • Quote
  • Edited at 10:30pm Oct 16, 2017 10:01pm | Edited at 10:30pm
  •  mambomango
  • Joined Apr 2016 | Status: Member | 175 Posts
Quoting Nicholishen
Disliked
{quote} The question was how to quantify choppiness. You can easily look at a chart a tell that it's choppy. Easy. Done. But how do you quantify it? Is it 0% chop or 100% or somewhere in-between? Also, why is it choppy? Is the entire market dead or are there other factors at play? Simply measuring up and down bars (unfortunately) won't give you those answers.
Ignored
lets asume you have such a chart where you can see the currencies seperate like i posted and you want to see which currency is choppy.
lets take the last 20 bars. you take the average of the close (maybe 20 SMA) and measure the distance of each bar to the MA.
the smaller the value the higher the choppiness. now you take the 1000 SMA of this value to get the average choppiness for the currency based on the 20 SMA, thats your 0 line and everything below is more choppy than the average. when i have passion i will code it tomorrow or you can do it its not difficult.
im not a friend of such solutions but maybe it helps some people.
now you see U is choppy and you can stay away from U pairs or maybe your strategy fits to choppy currencys.
 
 
  • Post #98
  • Quote
  • Oct 16, 2017 10:33pm Oct 16, 2017 10:33pm
  •  Nicholishen
  • Joined Jul 2005 | Status: zzzzzzzzzzzzzzzzzzzzzzzzz zzzzzzzzzz | 1,289 Posts
Quoting mambomango
Disliked
{quote} lets asume you have such a chart where you can see the currencies seperate like i posted and you want to see which currency is choppy. lets take the last 20 bars. you take the average of the close (maybe 20 SMA) and measure the distance of each bar to the MA. the smaller the value the higher the choppiness. now you take the 1000 SMA of this value to get the average choppiness for the currency based on the 20 SMA, thats your 0 line and everything below is more choppy than the average. when i have passion i will code it tomorrow or you can...
Ignored
"See" is not the same thing as "quantify". How do I tell my algo to "look at these lines and if they appear to be close and straight then it's choppy"?
 
 
  • Post #99
  • Quote
  • Oct 16, 2017 10:38pm Oct 16, 2017 10:38pm
  •  mambomango
  • Joined Apr 2016 | Status: Member | 175 Posts
Quoting Nicholishen
Disliked
{quote} "See" is not the same thing as "quantify". How do I tell my algo to "look at these lines and if they appear to be close and straight then it's choppy"?
Ignored
i think you didnt read my post carefully. you get a value and if the value is under the average your ea knows the market is choppy. its 100% quantified.
you can improve the algorithm maybe add 5% to the average or think about a new one. this is how i would do it.
 
 
  • Post #100
  • Quote
  • Oct 17, 2017 4:47am Oct 17, 2017 4:47am
  •  PipMeUp
  • Joined Aug 2011 | Status: Member | 1,305 Posts
Quoting Nicholishen
Disliked
Mathematically speaking, if EU and EJ are perfectly correlated then UJ has to be flat
Ignored
This is not true. Here is a counter-example. Let's normalize E/J and E/U so that they both start at index 1:
Inserted Code
E/U: 1 +2 -1   +3
E/J: 1 +1 -0.5 +1.5

Every step in E/JU is twice the size in E/J. Their correlation is 1. Their values over time is:
Inserted Code
E/U: 1 3 2   5
E/J: 1 2 1.5 3

U/J = E/J / E/U. So over time
Inserted Code
U/J: 1 2/3 3/4 3/5

It's not constant
No greed. No fear. Just maths.
 
1
  • Trading Discussion
  • /
  • Choppy market index: any good ideas?
  • Reply to Thread
    • 1 34Page 567 8
    • 1 4Page 56 8
0 traders viewing now
  • More
Top of Page
  • Facebook
  • Twitter
About FF
  • Mission
  • Products
  • User Guide
  • Media Kit
  • Blog
  • Contact
FF Products
  • Forums
  • Trades
  • Calendar
  • News
  • Market
  • Brokers
  • Trade Explorer
FF Website
  • Homepage
  • Search
  • Members
  • Report a Bug
Follow FF
  • Facebook
  • Twitter

FF Sister Sites:

  • Metals Mine
  • Energy EXCH
  • Crypto Craft

Forex Factory® is a brand of Fair Economy, Inc.

Terms of Service / ©2022