NEWS:
Current account n.s.a Jpy 1950
Building permits CAD 0830 and 0930
FOMC kashkari speech 1000
Monday Trading Plan
Daily:
ROMAR - Support
EMA - resistance
Parabolic - resistance
Checklist:
Last MACD 0 Crossing - down
Last EMA Alert Arrow - down
Last DB Attachment - Top at 134.392
Last SAR Attachment - Bottom at 131.737
Fibonacci - Red
Notes: Currently trading between the 23.6 (~132.80) and 38.2 (131.75) fibonacci. Purple cross smooth keeping PSAR as resistance. Four horsemen in downtrend. MACD negative. Lower Bollinger in trading zone. SAR attached to 38.2 fibonacci- market tested and did not pass as was strong support. EMA resistance currently at 132.47.
H4:
ROMAR - resistance
EMA - support
Parabolic - resistance
Checklist:
Last DB Attachment – Bottom at 131.829
Last SAR Attachment – Bottom at 131.849
Fibonacci - Green
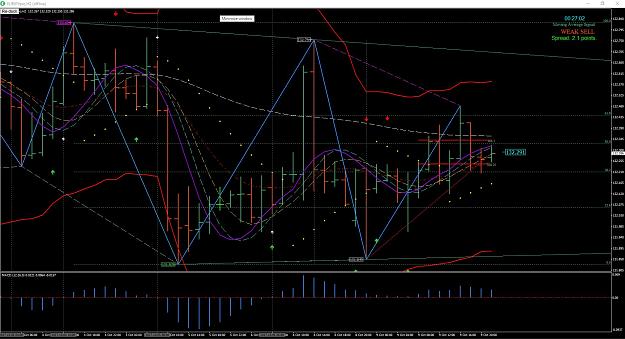
Notes: Recently market created the 0.0 fibo at 131.829, which caused DB and SAR to attach. This also corresponds closely to 23.6 fibo on daily chart. Market bounced to 132.75, with SAR attaching. This corresponds closely to daily 23.6 fibo. Market then retraced back down close to 0.0 fibo at 131.849, with SAR attaching, and has bounced up again. Four horsemen in uptrend with purple recently crossing EMA, causing EMA to become support. Romer currently at 132.42. Market near 38.2 fibo, with 50.0 fibo at 132.47 and 23.6 fibo at 132.12. Upper bollinger band in trading zone.
H2:
ROMAR - Resistance
EMA - Support
Parabolic - Support
Checklist:
Last MACD 0 Crossing - up
Last EMA Alert Arrow - down
Last DB Attachment - top at 132.48
Last SAR Attachment – out of window
Fibonacci - Green
Notes:
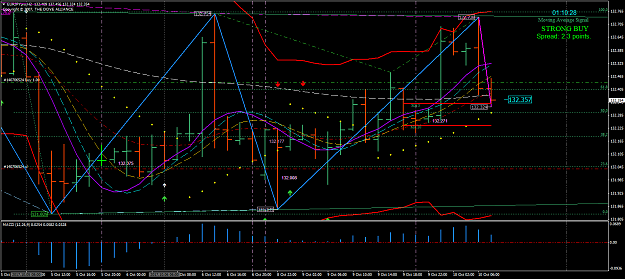
Market in consolidation recently creating 100.0 fibo at 132.82 with DB attaching, then down to 0.0 at 131.829 (w db), then up close to 100.0, then back down close to 0.0, and most recently back up hitting slightly past the 61.8 fibo (132.45) with divergence attaching at 132.48. Four horsemen currently in an uptrend with white in a slider under purple, approaching ROMER resistance (at 132.36). MACD up with Bollinger bands flat in trading zone at 132.57 and 131.88.
H1:
ROMAR - support
EMA - support
Parabolic - resistance
Checklist:
Last MACD 0 Crossing - down
Last EMA Alert Arrow - down
Fibonacci - green
Notes:
Earlier DB attached to top slightly past 61.8 fibo at upper Bollinger band. Purple cross smooth with likely soon flip of Parabolic. Market currently in-between romer and EMA support, also in between MA5 and MA20. Bollinger bands flat in trading zone at 132.52 and 131.95. EMA most recent arrow red, with recent white MACD arrow attaching.
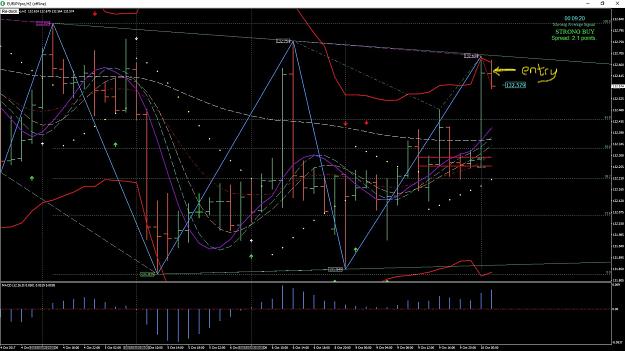
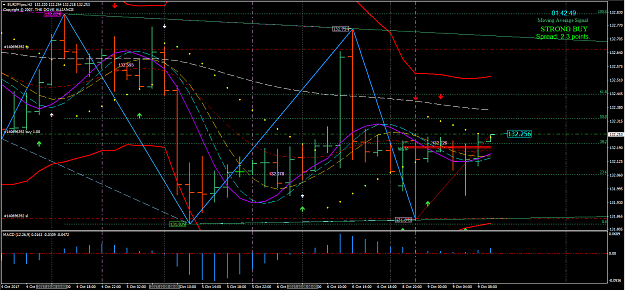
Final Notes: Market in consolidation so can trade in either direction. Major areas of resistance at 132.80 (D1- 23.6), (H4- 23.6/SAR), (H2 100 fibo). More closer resistance at 132.48 (H4 50.0/Romer), (H2 61.8/divergence/db), and H1 upper Bollinger band. Support at ~131.8 (D1- 38.2), (H4- 0.0 fibo), (H2 0.0/DB/lower bollinger band. Seemingly in the middle of the trading zone.
Entry: Will look to short near next confluence of resistance at ~132.48 as it is in line with 2 hour romer, and more than 40 pips to major area of support. Theres a couple high impact CAD news in 12 hours, and FOMC member speech around that time as well. If I am able to get in a short by then I will exit at least 5 minutes before the news per the rules.
Edit: New candle just opened on 2hr above mentioned confluence of resistance. DB, SAR and divergences attached to top of prior candle. Entered short at 132.65.
Current account n.s.a Jpy 1950
Building permits CAD 0830 and 0930
FOMC kashkari speech 1000
Monday Trading Plan
Daily:
ROMAR - Support
EMA - resistance
Parabolic - resistance
Checklist:
Last MACD 0 Crossing - down
Last EMA Alert Arrow - down
Last DB Attachment - Top at 134.392
Last SAR Attachment - Bottom at 131.737
Fibonacci - Red
Notes: Currently trading between the 23.6 (~132.80) and 38.2 (131.75) fibonacci. Purple cross smooth keeping PSAR as resistance. Four horsemen in downtrend. MACD negative. Lower Bollinger in trading zone. SAR attached to 38.2 fibonacci- market tested and did not pass as was strong support. EMA resistance currently at 132.47.
H4:
ROMAR - resistance
EMA - support
Parabolic - resistance
Checklist:
Last DB Attachment – Bottom at 131.829
Last SAR Attachment – Bottom at 131.849
Fibonacci - Green
Notes: Recently market created the 0.0 fibo at 131.829, which caused DB and SAR to attach. This also corresponds closely to 23.6 fibo on daily chart. Market bounced to 132.75, with SAR attaching. This corresponds closely to daily 23.6 fibo. Market then retraced back down close to 0.0 fibo at 131.849, with SAR attaching, and has bounced up again. Four horsemen in uptrend with purple recently crossing EMA, causing EMA to become support. Romer currently at 132.42. Market near 38.2 fibo, with 50.0 fibo at 132.47 and 23.6 fibo at 132.12. Upper bollinger band in trading zone.
H2:
ROMAR - Resistance
EMA - Support
Parabolic - Support
Checklist:
Last MACD 0 Crossing - up
Last EMA Alert Arrow - down
Last DB Attachment - top at 132.48
Last SAR Attachment – out of window
Fibonacci - Green
Notes:
Market in consolidation recently creating 100.0 fibo at 132.82 with DB attaching, then down to 0.0 at 131.829 (w db), then up close to 100.0, then back down close to 0.0, and most recently back up hitting slightly past the 61.8 fibo (132.45) with divergence attaching at 132.48. Four horsemen currently in an uptrend with white in a slider under purple, approaching ROMER resistance (at 132.36). MACD up with Bollinger bands flat in trading zone at 132.57 and 131.88.
H1:
ROMAR - support
EMA - support
Parabolic - resistance
Checklist:
Last MACD 0 Crossing - down
Last EMA Alert Arrow - down
Fibonacci - green
Notes:
Earlier DB attached to top slightly past 61.8 fibo at upper Bollinger band. Purple cross smooth with likely soon flip of Parabolic. Market currently in-between romer and EMA support, also in between MA5 and MA20. Bollinger bands flat in trading zone at 132.52 and 131.95. EMA most recent arrow red, with recent white MACD arrow attaching.
Final Notes: Market in consolidation so can trade in either direction. Major areas of resistance at 132.80 (D1- 23.6), (H4- 23.6/SAR), (H2 100 fibo). More closer resistance at 132.48 (H4 50.0/Romer), (H2 61.8/divergence/db), and H1 upper Bollinger band. Support at ~131.8 (D1- 38.2), (H4- 0.0 fibo), (H2 0.0/DB/lower bollinger band. Seemingly in the middle of the trading zone.
Entry: Will look to short near next confluence of resistance at ~132.48 as it is in line with 2 hour romer, and more than 40 pips to major area of support. Theres a couple high impact CAD news in 12 hours, and FOMC member speech around that time as well. If I am able to get in a short by then I will exit at least 5 minutes before the news per the rules.
Attached Image (click to enlarge)
Edit: New candle just opened on 2hr above mentioned confluence of resistance. DB, SAR and divergences attached to top of prior candle. Entered short at 132.65.