Can any coder please code a volatility indicator for MT4 which can predict the probability of the future volatility through an indicator based on the spot price feed?
I am trying to find entry points for currency options as well as monitor the trades on standard MT4 platform.
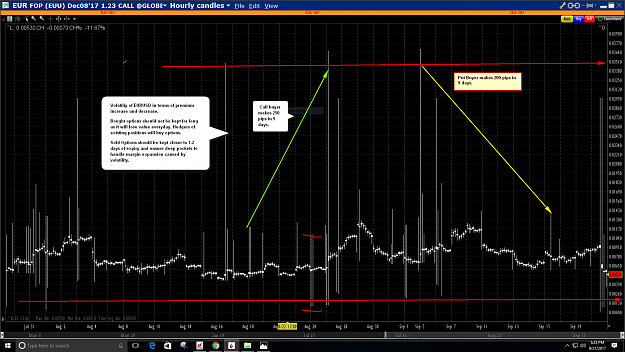
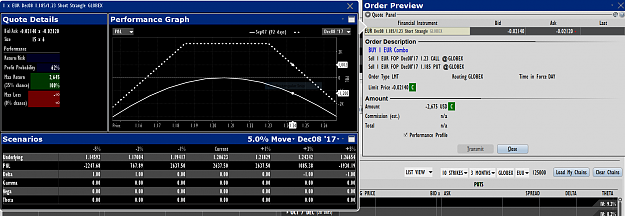
For directionless trade, we need the strike prices to be displayed on the chart. my high low does that, and we need to monitor the volatility and keep adjusting to ensure options remain OTM by tracking Vega and Delta. A 100% per year return on margin money invested is normal if one keeps adjusting when the price gets volatile and crosses the high and low boundaries.
For directional trade, we need an indicator as per the strategy. I have tried to make it look simpler by choosing overbought/oversold strategy indicator of highlowmidpoint.
Trading with directional bias is like trading spot fx but without having the necessity of have Stop Loss, which can be an immediate loss when it is hit, and giving a lot of opportunities to be wrong. Buying options and keeping it for a long time can be counter-productive. Selling options is what most people do when they have enough margin in their account.
Buying and selling of the underlying (EurUsd futures), call and put options are involved. An experienced spot fx trader can learn to trade fx options in couple of days.
No rocket science. Educators make it look like complex but it is not. If sufficient interest is shown here to learn it, I can discuss strategies.
Volatility plays an important part in selection of the options. I am attaching indicators which supposed to calculate historic volatility.
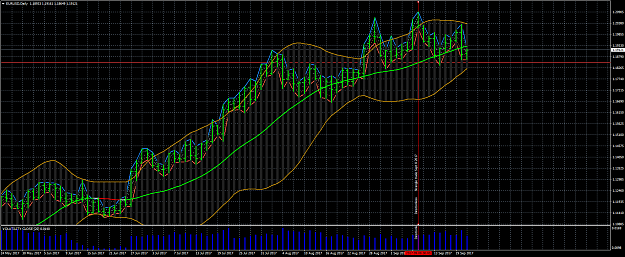
Historic volatility and Implied volatility indicators are what I am looking for. I am now busing Bollinger Band as implied volatility indicator.
Is it possible to mimic BB as predictor of Implied volatility indicator by inputting actual implied data from the option chain and putting another input of +/2 of percentage wise as the predicting factor?
If the indicator print overlays at the bottom like the one is done for resistance and support in the attached chart.
I am trying to find entry points for currency options as well as monitor the trades on standard MT4 platform.
For directionless trade, we need the strike prices to be displayed on the chart. my high low does that, and we need to monitor the volatility and keep adjusting to ensure options remain OTM by tracking Vega and Delta. A 100% per year return on margin money invested is normal if one keeps adjusting when the price gets volatile and crosses the high and low boundaries.
For directional trade, we need an indicator as per the strategy. I have tried to make it look simpler by choosing overbought/oversold strategy indicator of highlowmidpoint.
Trading with directional bias is like trading spot fx but without having the necessity of have Stop Loss, which can be an immediate loss when it is hit, and giving a lot of opportunities to be wrong. Buying options and keeping it for a long time can be counter-productive. Selling options is what most people do when they have enough margin in their account.
Buying and selling of the underlying (EurUsd futures), call and put options are involved. An experienced spot fx trader can learn to trade fx options in couple of days.
No rocket science. Educators make it look like complex but it is not. If sufficient interest is shown here to learn it, I can discuss strategies.
Volatility plays an important part in selection of the options. I am attaching indicators which supposed to calculate historic volatility.
Historic volatility and Implied volatility indicators are what I am looking for. I am now busing Bollinger Band as implied volatility indicator.
Is it possible to mimic BB as predictor of Implied volatility indicator by inputting actual implied data from the option chain and putting another input of +/2 of percentage wise as the predicting factor?
If the indicator print overlays at the bottom like the one is done for resistance and support in the attached chart.
Attached Image(s) (click to enlarge)
Attached File(s)
Practice makes a person perfect