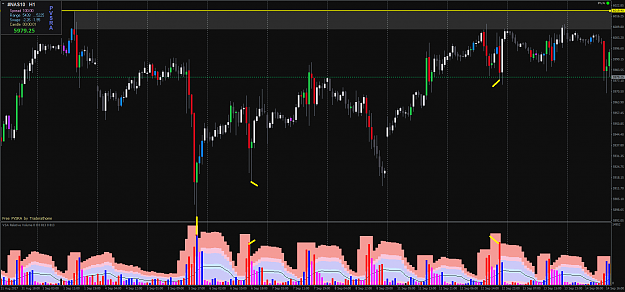
Nasdaq 100.
Charts are from Dec2017 "Z7". You might have the different price quote.
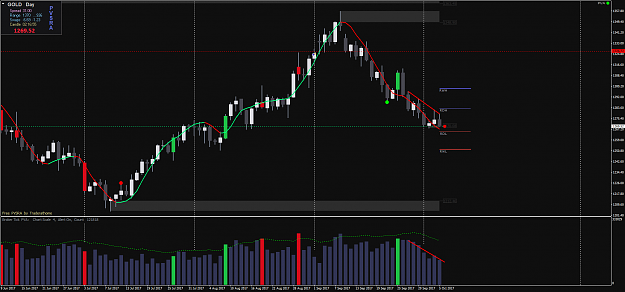
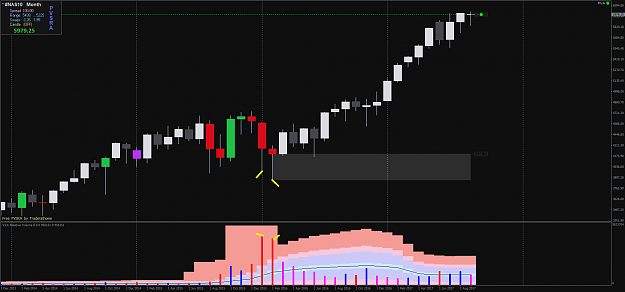
The news is we have reached the highest point of history in the market. A collapse is expected.
Selling is almost disappeared.
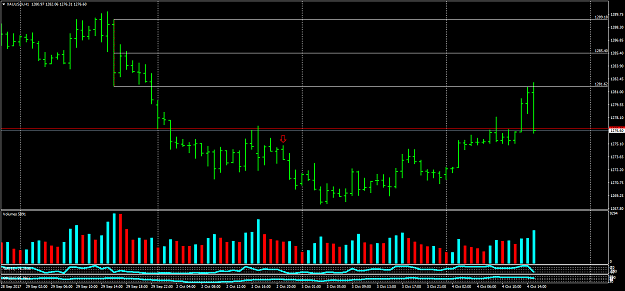
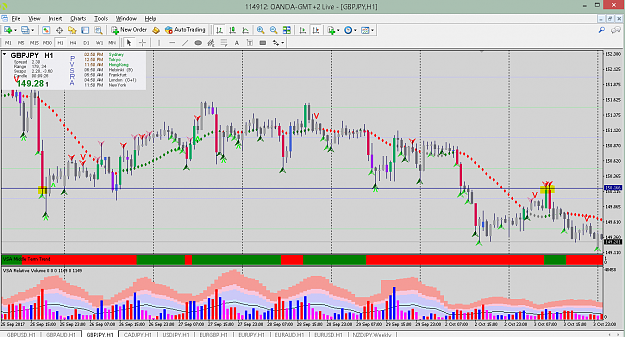
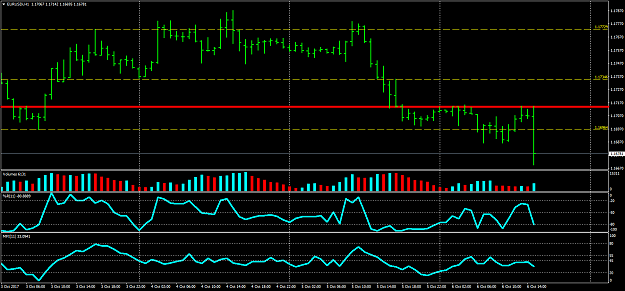
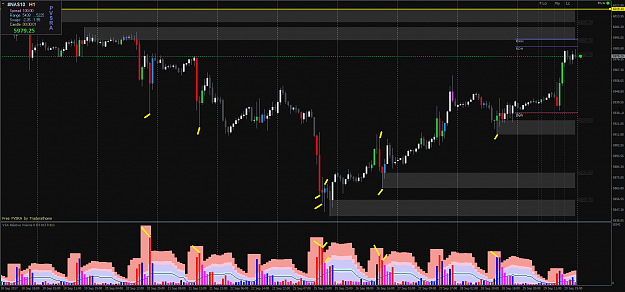
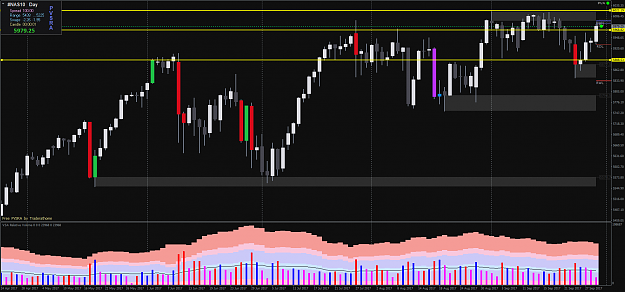
Chart1 and Chart2 are hourly charts from 1st Sep to 29th Sep.
Break above 6020 and an easy 6500. Targets for long entries 6100 and 6150.
Downside Test area is 5905 and 5965.
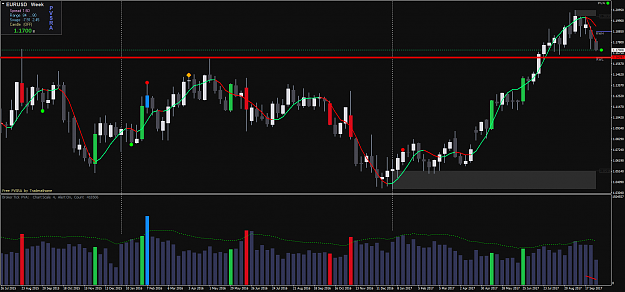
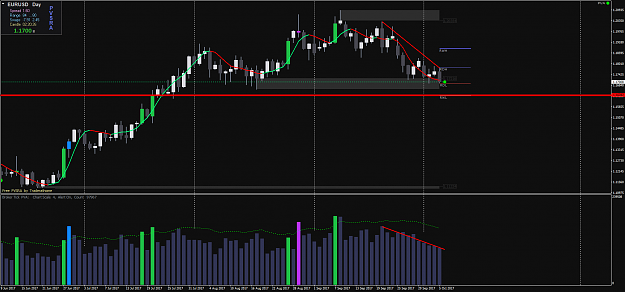
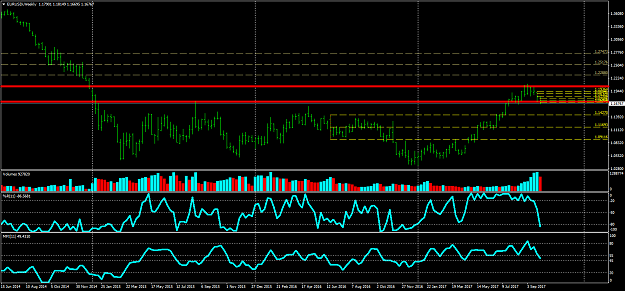
The monthly chart is also an interesting one.
Charts are from Dec2017 "Z7". You might have the different price quote.
The news is we have reached the highest point of history in the market. A collapse is expected.
Selling is almost disappeared.
Chart1 and Chart2 are hourly charts from 1st Sep to 29th Sep.
Break above 6020 and an easy 6500. Targets for long entries 6100 and 6150.
Downside Test area is 5905 and 5965.
The monthly chart is also an interesting one.
Attached Image(s) (click to enlarge)
Holy Grail - Patience and Acceptance