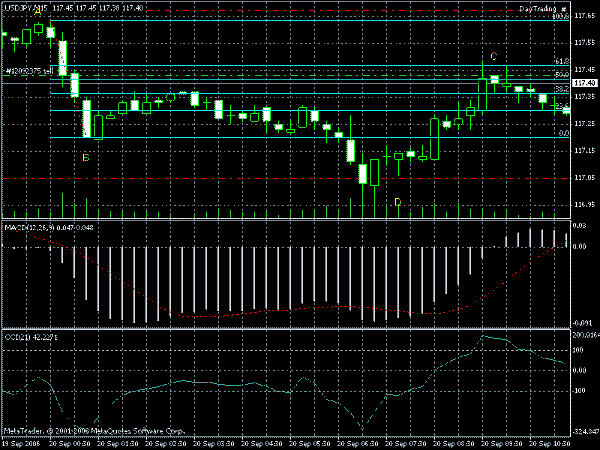
Help with Fibonacci retracement setup.
I have read a few threads on Fibonacci retracements, and I am trying to clarify a few thing up:
1. From where to where do I draw the first line. In an up trend, Do I draw from the low of one bar to the high of the other? Or do I use the close of the low to the close of the high? Basically, do I use the real body of the candlestick, or the shadows?
2. How is a low or a high defined? in the case of a high, do the candlesticks on either side have to be lower, or at least equal? opposite when defining a low.
3. How long do you wait to tell if it is an fact a retracement? if it took 8 bars to define the line from low to high, how many bars should the line from high to retracement take? Should I move on if it doesn't retrace in a specified amount of time?
Rusty
- Just a newbe trying to swim in shark infested waters.