in this thread i'm going to shed some light on how to read a price chart.
there's a lot of hocus pocus and conspiracies going about when it comes to trading.
i hope i can clear the dust for some, and show you the only thing that ever really worked for me.
what you'll find here:
- how to read a trend
- how to read momentum
- how to differentiate between cheap & expensive prices
- how prices turn
- how levels work
what you won't find:
- a get rich quick system
- indicators
- a step by step guide
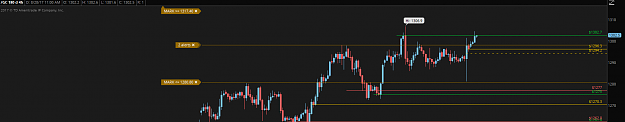
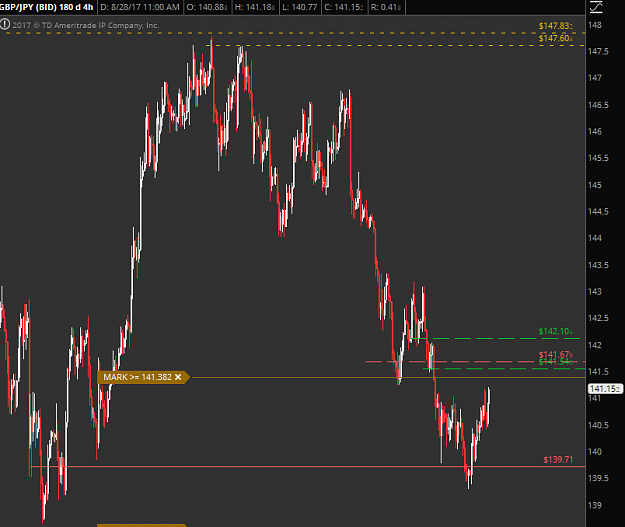
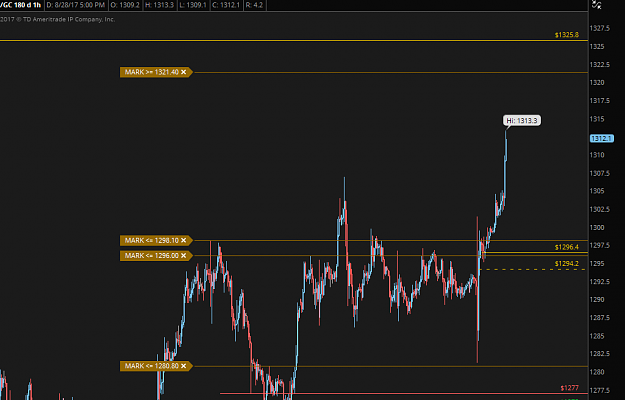
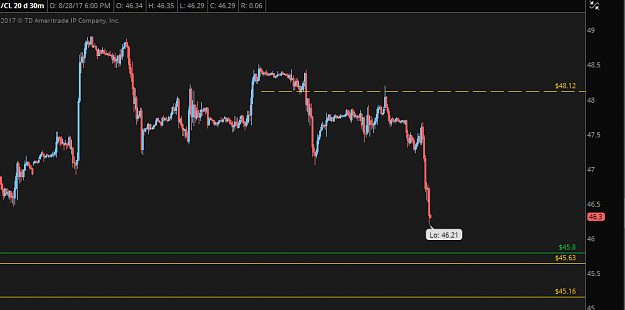
i'm sure most of you have some experience with sr & sd techniques, and like most things in trading, they kind of work.
they don't work to the extent though that you can consistently make money off of them. at least that was my problem with most sr/sd strategies.
took me a long time to realize that drawing levels on a chart is only like 10% of the process. and that it doesn't matter exactly how you draw your sr or sd levels, as long as you see them kind of work. to trade it profitably, you need to understand how to read a chart.
you won't need any indicators, or templates to follow this thread. a simple bar or candlestick price chart will be enough.
i'll do my best to keep the thread running with live time charts, although i'd recommend everyone to make use of their chart history.
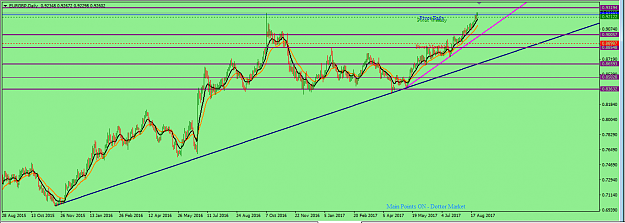
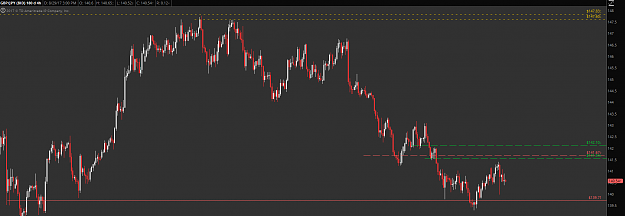
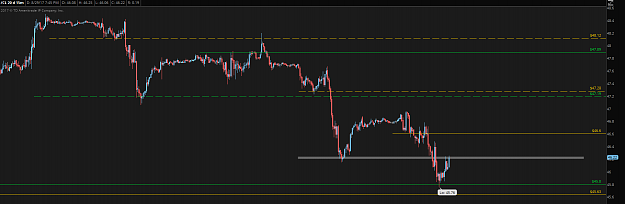
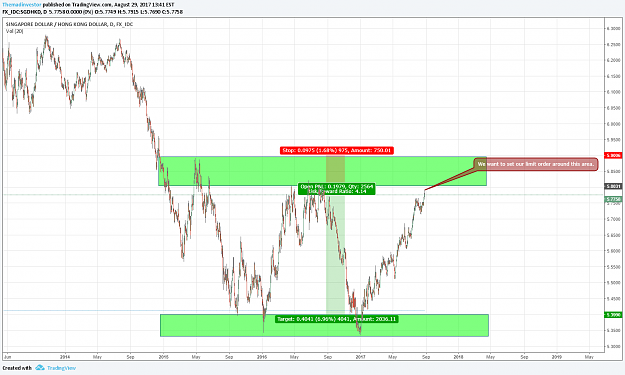
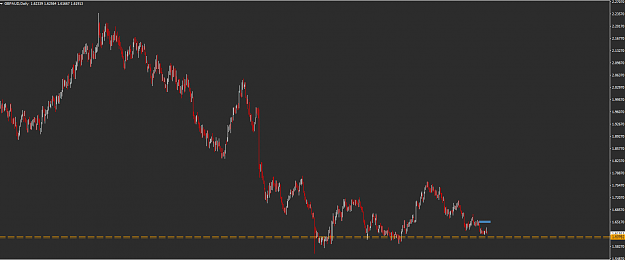
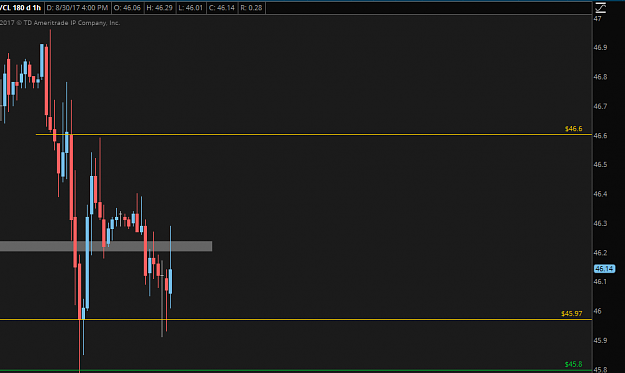
the charts i'll post in here will be futures & spot fx.
feel free to ask questions.
good luck everyone