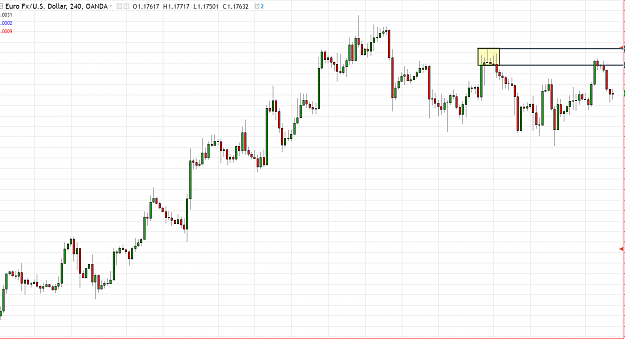
Disliked{quote} Good evening AKT I was browsing through past pages & a query rose on seeing this post. Why did opt to short on H4 chart despite the price being low on curve & testing the weekly demand. From my understanding.. the weekly demand was no longer fresh due to the test that happened 3 weeks ago. Please clarifyIgnored
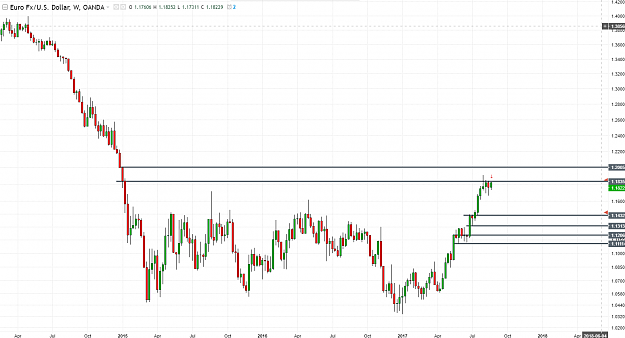
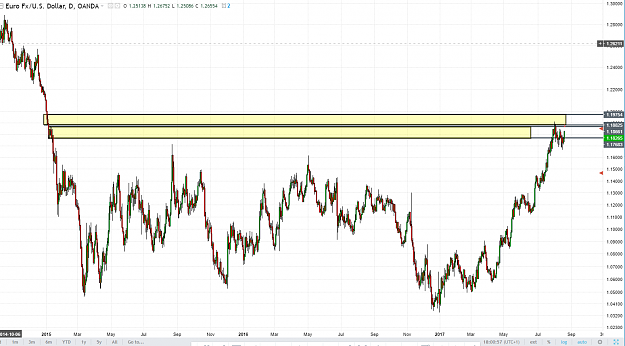
Price was at weekly supply when the short was triggered, high, rather than low on the curve.
Take a look at the weekly chart again, the SZ is highlighted there
best wishes
Be careful what you think because your thoughts run your life..Solomon