{quote} here is the 60 Once again below the pink line ...sell the crap out of her There appears to be supply and confirmation by a no demand or upthrust on 60 would confirm the weakness. {image}
Ignored
On the weekly chart it looks like AU wants to test the 8162 from May 2015 again… that could be next week. If so, the 81xx area would be a wonderful selling point… if supported by no demand.
{quote} On the weekly chart it looks like AU wants to test the 8162 from May 2015 again that could be next week. If so, the 81xx area would be a wonderful selling point if supported by no demand. BTW... see that you are still here in Dubai
Ignored
send me an inbox with your phone .... we should connect
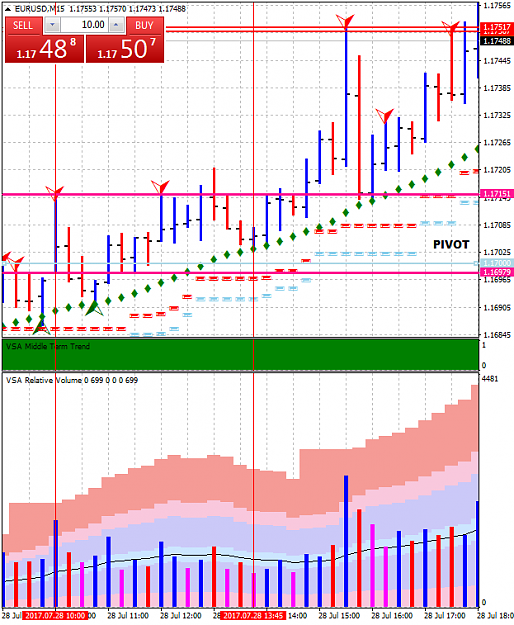
here is a euro chart .. light blue line is the prior days daily pivot. 1.7000 . we traded above it ... so could assumed OR breakout. I have not used pivots for years. Plenty of supply in this chart on the way up .... but trend was UP so no sells are allowed according to my rules. {image}
Ignored
Chart is vertically squeezed. price chart is more important than window with indicator and volume.
{quote} Friday was an ' odd day ' the up moves in majors saw some supply entering the market. we will see hwo the week plays out next week The Dow ticked to a new all time high ... God Bless America. And at the same time Gold ramped to 1270 area. .... Forget about correlations they have vanished.
Ignored
These days happen. Have seen even weeks and months. Good money management skills required to survive these periods.
Malc, I'm interested why you don't follow TG sharpshooter strat?
Ignored
that's a question I asked myself today ... lol . When I come up with an answer i will let you know.
I like the sharpshooter and I do trade the strategy ... trading in the trend looking for sow or sos depending on the trend direction .
I also only like to trade when 60 min down is in trend alignment for intraday. For swings / two day holding I do look for trades in alignment with daily / 4 hour.
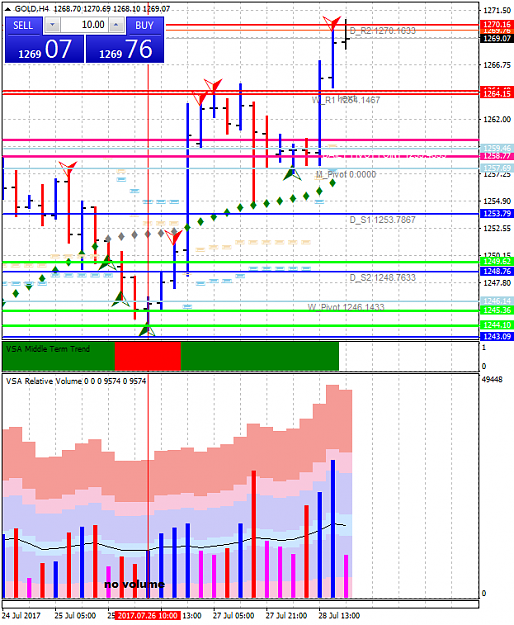
I was in the market on Friday but waiting for Gold set up to work .. 4 hour trending UP I wanted to buy test 1257.( which we can see is the monthly pivot but also a s/r area I have marked on the charts)
lok . now i got pivots on charts ,. ... I will see if they are of use at all .... next i will add macd , stochastics and rsi lol .... NEVER
here is a euro chart .. light blue line is the prior days daily pivot. 1.7000 . we traded above it ... so could assumed OR breakout. I have not used pivots for years. Plenty of supply in this chart on the way up .... but trend was UP so no sells are allowed according to my rules. {image}
Ignored
The trend is not just your friend; it's your lover. As the late, great, Tom Williams used to say, " A trend tends to go on longer than you think it should". We should not forget:
"In a way, the most interesting principle that Isaac Newton pointed out is that bodies have inertia; that is, that they tend to keep doing whatever it is they're already doing, unless some force acts to change them.
If a body is at rest, it tends to stay at rest. If a body is moving, it tends to keep moving-in the same direction and with the same velocity that it already has.
Einstein referred to this as 'laziness'. That is, a body tends to do the laziest thing possible-and the laziest thing possible is to continue to do whatever it's already doing. Making a change of any kind, either in direction or velocity, is far less lazy, and therefore not done, unless the curvature of space-time-what Newton would refer to as 'force'-compels it to do so.
The market is exactly the same, it tends to keep doing whatever it's already doing. If it's going UP with a certain velocity it will tend to keep doing that unless some force (buying or selling pressure) causes it to accelerate or decelerate. The same thing if it's going down. The same thing if it's doing nothing." - The Adam Theory of Markets, pg 56-57.
Attached Image (click to enlarge)
Without VSA, you're playing checkers while the Smart Money plays chess.
{quote} The trend is not just your friend; it's your lover. As the late, great, Tom Williams used to say, " A trend tends to go on longer than you think it should". {image}
Ignored
big shout out to a true trading master ... Hiddengap
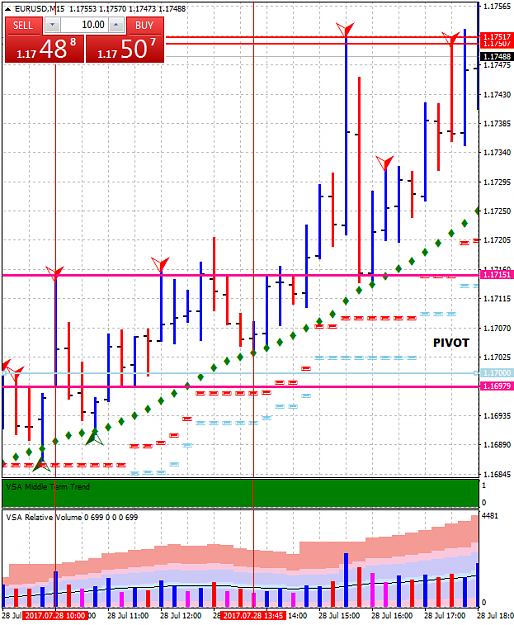
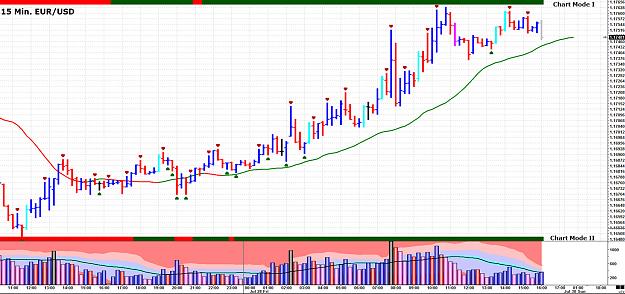
{quote} falcs ... which is better 1 or 2 ... see that low volume test perfect entry for the buy (second vertical bar) for me the volume is the first thing I look at on each bar .. the small screen for volume on bottom you cannot see squat I will stick to my big arse volume window .. lol {image} {image}
Ignored
2 is better for me but don't listen me. I still think that price is most important info..besides above some bars you have VSA information; it doesn't make difference even you split chart on two : half for bars and half for volume...
{quote} 2 is better for me but don't listen me. I still think that price is most important info..besides above some bars you have VSA information; it doesn't make difference even you split chart on two : half for bars and half for volume...
Ignored
Good morning .. we can agree to disagree
interesting thing about the tg plug in is that it misses some key trading oops ... such as the low volume test you saw in the euro chart . So for me to see volume it's important .
at the end of the day if price action is important for you and you make money or having big arse volume window is important to me and I make money .. the key is the results not how you get there
some traders only trade a naked chart buying or selling support / resistance with tight stops and letting winners run .. 50 percent of the time they will be right and 50 percent wrong but if the r/r is 1:4 they will make money
so there are a million ways to get the results but the results are what's important
{quote} The trend is not just your friend; it's your lover. As the late, great, Tom Williams used to say, " A trend tends to go on longer than you think it should". We should not forget: "In a way, the most interesting principle that Isaac Newton pointed out is that bodies have inertia; that is, that they tend to keep doing whatever it is they're already doing, unless some force acts to change them. If a body is at rest, it tends to stay at rest. If a body is moving, it tends to keep moving-in the same direction and with...
Ignored
In other words until fundamentals get priced in.. higher tf swings happen as a result.