ENtry System With 2 Entry And SL TakeProfits
ShowCalc: this option will turn on/off the visual display of thecalculations used for EntrySystem.
ShowComments: this option will turn on/off the comments
shown at the upper left hand of the screen.
Font_Size: this adjusts the size of the font viewable on the
screen.
Corner: (1-4) this sets the corner of the screen where the text can
be viewed.
Template[Customize]
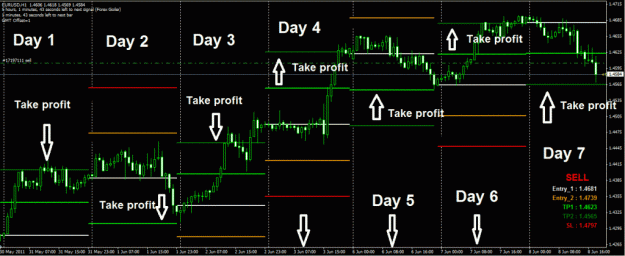
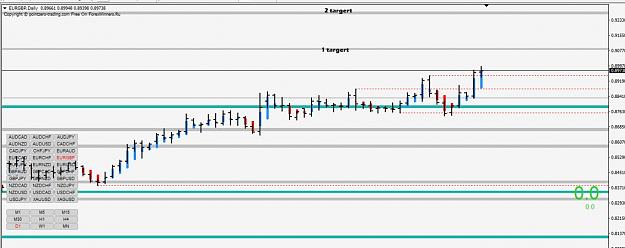
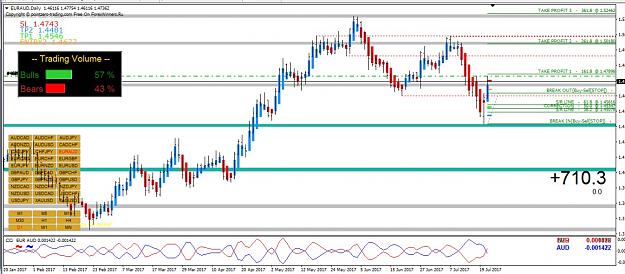
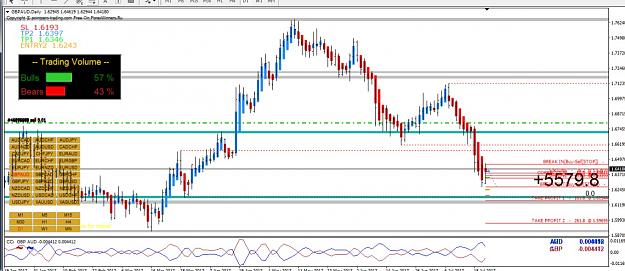
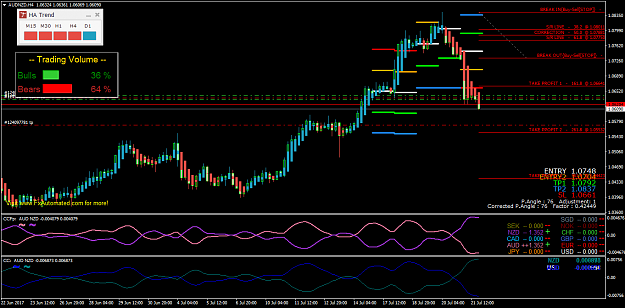
As you can see at the bottom right corner, the current signal will be displayed as either
a BUY or SELL, with the corresponding entry, exit, and stoploss levels. They are also color
coded for easy reference. On the actual chart, these levels will be displayed with the
appropriate color and level. The white line is Entry level #1. This is where the signal will
start. The orange line is Entry level #2. If price has opposite momentum or changes trend in
opposition to the EntrySystem signal, this entry level can be used as an alternative entry. The two
green lines are two different takeprofit levels. The first is recommended for use with Entry #1
(white line). The second can be used for a more aggressive exit, or used in conjunction with
trailstop, partial takeprofit, and/or breakeven at the TP#1 level. It is important to lock in profit
at certain levels, but that will not be discussed here.
If your entry was the orange Entry #2, your first TP will be the white line (Entry #1).
Again, you can lock in profits by closing the trade or trailing the trade to the next level,
whatever fits your trading style. The red SL line represents the recommended stoploss level
for Entrysystem, and is not recommended for an entry level, as price may continue its momentum
against the signal.
to better figure out the chart.i used a few Good indicators and this helps to improve the system.
also, a better trader can recognize the direction and direction of the market.
in fact,in order to improve my result,i used my own experience and coded them and combined them.to be more easily used.if there is a problem,let me know.
Entry1
Entry2
TakeProfit1
TakeProfit2
SL
you can test on demo and announce the results here.
Risk Management:
The first point to make is that you should not risk more than 1-2% of your account per
trade. Use the following equation to calculate your risk per trade:
Account Size ($) divided by 100 multiplied by risk (%) = risk ($) per trade.
Risk ($) per trade divided by stop loss = $ risk per pip.
So if you were risking 2% of your $5,000 account and your stop loss was 15 pips, you would
calculate the following:
$5,000 divided by 100 multiplied by 2% = $100 per trade.
$100 per trade divided by 15 = $6.6 per pip.
In the example above a loss of 15 pips ($6.6 per pip) would be $100 (2%).
Go over and over the above until you fully understand it. Proper psychology and
money management are important keys to successful trading.
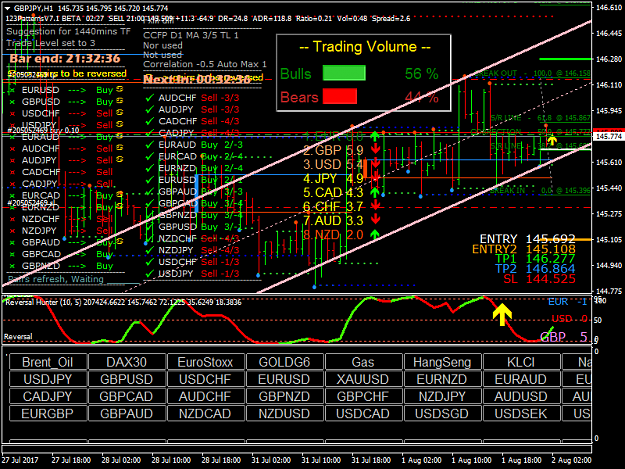
Recommended currency: this indicator was calibrated for the
EURUSD currency, &{GBPCAD,USDCHF,EURAUD,EURNZD,EURUSD,USDCAD,NZDCAD,GBPAUD,EURGBP,CHFJPY,CADCHF,AUDNZD,AUDJPY,AUDCAD,AUDUSD,EURCHF,EURCAD,NZDCHF,GBPJPY,GBPUSD,AUDCHF,NZDJPY}and is not recommended for other currencies. It can
be used on any TF from Daily to below.
non-Recommended:EURJPY,GBPNZD,GBPCHF,USDJPY,CADJPY,NZDUSD)
Instructions: Signals will begin at each market day according to your preset GMT offset.
Note that Monday’s signal may begin near the end of Friday’s market if your GMT is greater
than 0.
You should see something similar to this (I have chosen a non-recommended pair just so we
can have a nice clean chart).
=============================
3.Indicators.........(CLICK-DOWNLOAD-MQL5.com)
Trading..Volume (https://www.mql5.com/en/market/product/15939)
tipu.heikinashi. (https://www.mql5.com/en/market/product/12205)
reversal (https://www.mql5.com/en/market/product/1832)
https://www.mql5.com/en/market/product/15939
https://www.mql5.com/en/market/product/12205
https://www.mql5.com/en/market/product/1832
=========================
-------------------------------------------------
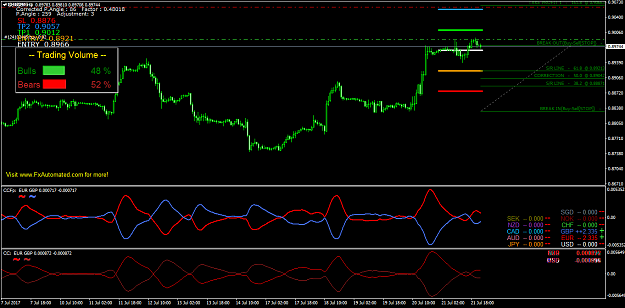
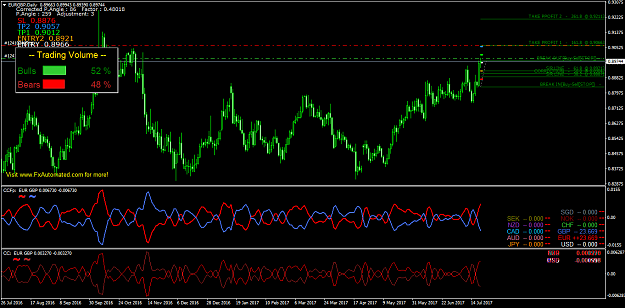
- Reversal Hunter is a new leading oscillator. It monitors small changes in volume and price volatility using second derivative, thus providing an accurate prediction of trend reversals.
Though Reversal Hunter shows its best results with reliable volume data, special option of "synthetic" volume (which uses OHLC data only) is implemented to optimize performance in case of poor or missing volume data.
The oscillator is drawn as two-color line for easy detection of trend changes. -
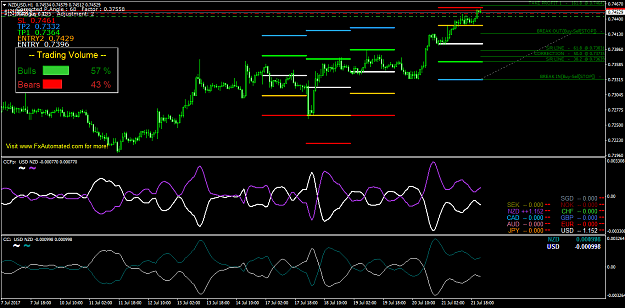
Trading Volume indicator shows the volume of Buying and Selling Trades on the Current Bar Or on average of specific number of last bars as you want . Both volumes are shown simultaneously with green and red colors for Buying and Selling Trading Volumes respectively. And a Percentage ratio of both Volumes appears too in same colors. And Buying and Selling Volumes Expressed By Bulls & Bears .
Notice : This indicator Works on any timeframe and any Pair of Currencies -
------------------------------------------------------------------------------------------------------------------
Some friends have said that the Ccfp indicator is not working for them and is having difficulty.
The reason for this is that their account with the symbol micro is not appearing on the chart.
I coded it. Just fix and fix the bugs in this topic.
This version is for friends using a micro-account only.
name:CcFp-Diff-NestaV.4 for use micro and remove Ccfpdiff ver2
--------------------------
V3
Due to the follow up and testing of friends, I changed a bit of the new version in version 3.
In version 3 I deleted heikinashi due to the problems. Because it did not work for many friends and should only download Mql5. That had this problem.
In version 3, I used a new indicator that displays Bull Blue and Bear Red and Yellow Flat graphically and accurately.
I removed the previous Breakout and used a better breakout system instead. That is, my system is actually my fellow PrinceJ58 already. And I made some changes and I changed a bit in coding and I used another.
And I thank the Princej58 for having introduced the system before. Of course, I rewrite and made some changes.
The signals on the left side of the chart are offered daily and every 24 hours.
It's best to match the Entry system and do the right entry in Entry1 entry2 trade.
In fact, the signals on the left are signals that we can use in the system at 1440 minutes.
Many friends had asked about Fibo
Fibo:
In fact, every 1440 minutes per day is plotted on the chart. If it's red, its color indicates that it's likely to be down, and if it's green, it's bullish. Of course, this indicator has nothing to do with our system. And just for more confidence on the chart, it is very useful.
In the breakout system
The system automatically and dynamically adjusts the lines with Fibo Yellow patterns and 2 to 2-point dots every time they feel comfortable.
Entry1 Target
Shows us as Buystop sellstop.
That is, the yellow Fibo and the dotted lines are basically our breakout system.
Now, what's the matter with the system?
Answer: There is nothing to do. The system shows a long-term signal every 24 hours, 1 time, non-repaint non lag ever repeat on each pair of currencies.
And the Breakout system helps in more accurate and convenient Pending and better entry and buy and sell with automatic yellow fibo drawing.
So first we see the signals on the left of the chart. And it suggests we should trade today in these pairs of currencies.
And with the indicators and the system, we find the Breakout Entry and Trend a bit. If it matches our signal system that is very good. If it goes against the direction of the signal of the system ...
We recognize well.
In fact, I have gathered all the professional tools that we need for Exit entry tp sl into a complete system.
Reversal
Both the first position is fully described, which shows the return of the price, from 95 to 100 return probabilities, and from 5 to 0 at the bottom, the possibility of returning the price up.
The Ccmft indicator also displays the cross up doen slope gap in the middle histogram, and also has an alert.
Hope you noticed.
V3.2FINAL
if The Indicator Does Not Display On Your Chart(3)
Download==>Multi Currency Trend Strength Indicator Basic (https://www.mql5.com/en/market/product/22388#full_description)
Trading..Volume (https://www.mql5.com/en/market/product/15939)
reversal (https://www.mql5.com/en/market/product/1832)