{quote} Master -Mind, AudUsd is buy or sell? Can you share on how to set the criteria to enter trade Base on your currency indicator? Thanks
Ignored
WAIT TO OVERBOUGHT (THROUGH OUR INDICATOR OR EVEN THROUGH rsi- or anything you like)
THEN SELL
AND PUT TWO PENDING ORDER
0.02 (OVER-OVER-BOUGH: ASSUMED)
AND 0.04 (OVER-OVER-OVER-BOUGH: ASSUMED)
FAR 100M 200 PIPS RESPECTIVELY AND WAIT FOR TARGET MORE THEN 200 PIPS(EPEND ON PAIR VELOCITY)
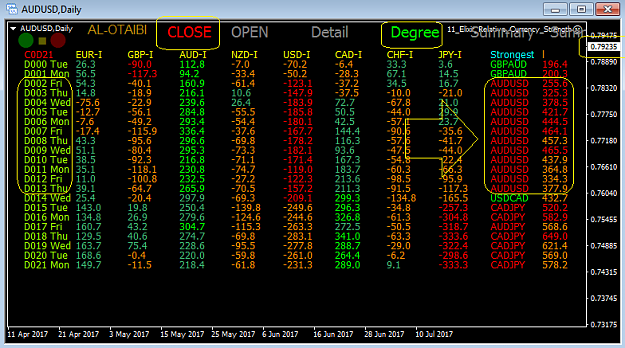
IN PICT ABOVE: you see GBPAUD, THE MOST VOLATILE PAIR TODAY. C0D0 C0D0: CLOSE THIS DAY-OPEN THIS DAY, C2D3: CLOSE 2 DAYS AGO -OPEN FIVE DAYS AGO , (5=2+3) IMAGINE IT AS 3DAY FRAME. EACH THREE CANDLES CONSIDERED ONE CANDLE.
Ignored
You have peaked my interest as long time back, I had worked with a developer (here at FF) to help me build a session based candle generator to feed data into my movers and shakers indicator I attached earlier. He learnt all the strategy details and developed but then bailed on me after 3 months. He provided a non-working compiled version making some stupid confidentiality excuse that he cannot share the code as it uses some libraries paid by other clients. Utter BS. You get what you pay for which is nothing :-(
Anyways, reading this post, I understand the ultimate power/force your indicator can depict BUT I fear, it will not result in consistency of trading outcome and that is why you are trading reversals with recovery grid.
I feel inconsistency is introduced because of following reasons:
This tool has no input parameters to always force the 5pm ET daily close regardless of broker's offset
This tool does not let you chose timeframe other than daily. There is NO official close in FX other than the Weekly close. Weekly candle is the only candle that is consistent BUT that is also skewed because of 5 or 6 day daily candles. This entire Retail FX platform we call MT4 is designed to introduce inconsistency at the servertime, GMT Offset, candle level. Primary reason why strategies don't last forever.
I did not see any way to change the C0D21 to C1,C2. I am sure there should be a way to change in setting (in the screenshot)
Now, here's what I suggest if we want to significantly exploit the power of this tool. Replace the "D" in your tool with a Session Candle.
One Sessions(Candle):
London-Only (for GBP, EUR Strength)
London+US (Overlap) (for GBP+JPY Strength)
USA-Only (ALL 7 >> GBP, EUR, JPY, AUD, NZD, CAD, CHF)
TOKYO (for JPY+AUD+NZD+CAD)
T+L (for JPY, EUR and GBP)
Outside of the main sessions for each country is considered 'price manipulation zone' and to be ignored in our strength calculation. This will give us directional bias and then when you entry becomes insignificant.
Too complex for some but this is how currency markets are designed to function. Focus should be to exploit what happens all day every day, all week every week until the central banks step in and then we reverse and continue to follow the strength all day every day, all week every week. IF this behavior in price movement is not evident to the naked eye, then markets are stuck in a range and that will evidently show up very easily in the tool as a red/green/red/green heatmap for us to avoid.
EDIT: Perhaps I should mention. Session Time should be based on UTC and not broker time to make this a universal approach to achieve consistency. It should have no impact on broker offset or local DST changes.
EDIT1: I figured out 1,2 and 3 after playing around with the tool.
{quote} You have peaked my interest as long time back, I had worked with a developer (here at FF) to help me build a session based candle generator to feed data into my movers and shakers indicator I attached earlier. He learnt all the strategy details and developed but then bailed on me after 3 months. He provided a non-working compiled version making some stupid confidentiality excuse that he cannot share the code as it uses some libraries paid by other clients. Utter BS. You get what you pay for which is nothing :-( Anyways, reading this post,...
Ignored
VEEFX,
Could you please elaborate more on your statement:
"Too complex for some but this is how currency markets are designed to function."
How are they designed and with purpose are they designed?
But to make EA such that, you need a currency strength meter and that too a very good one. I recommend Tom's Accustrengh meter but I am not sure if it is possible to extract data from a 3rd party software in MQL.
IN PICT ABOVE: you see GBPAUD, THE MOST VOLATILE PAIR TODAY. C0D0 C0D0: CLOSE THIS DAY-OPEN THIS DAY, C2D3: CLOSE 2 DAYS AGO -OPEN FIVE DAYS AGO , (5=2+3) IMAGINE IT AS 3DAY FRAME. EACH THREE CANDLES CONSIDERED ONE CANDLE.
Ignored
Where can I find this indicator/EA? Can you please provide the link for download?
Thank you.