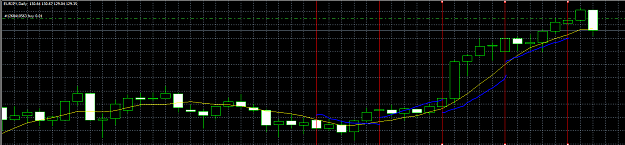
Anyone here has this type of MA for the weekly or monthly or quarterly?
It really helps me trading daily but if weekly and monthly ma is shown.
More information would be made and can help to know direction and positioning.
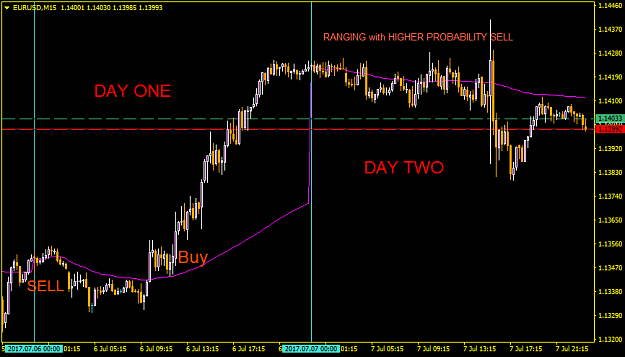
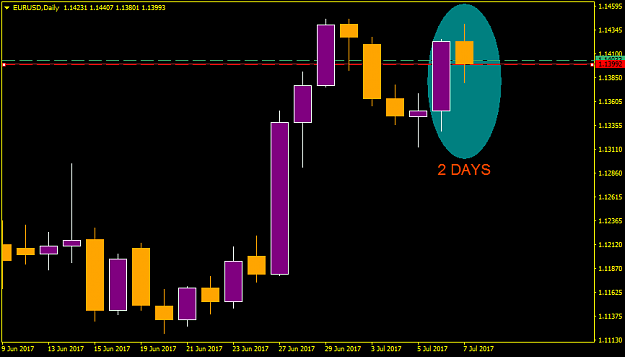
Here is a picture where the purple resets everyday.
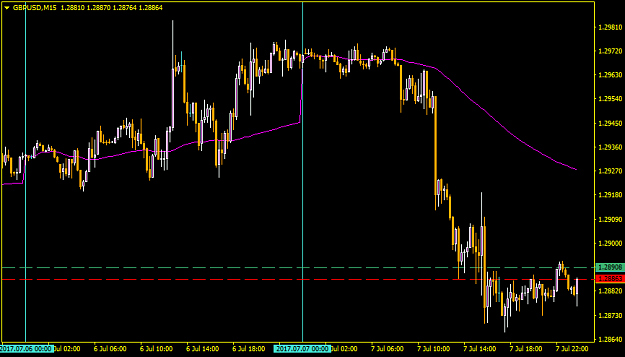
Any price above the ma is a buy for the day until the day ends or sell if below.
If this can be done weekly or monthly that would really help me
Indicator is attached for those willing to help.
It really helps me trading daily but if weekly and monthly ma is shown.
More information would be made and can help to know direction and positioning.
Here is a picture where the purple resets everyday.
Attached Image (click to enlarge)
Any price above the ma is a buy for the day until the day ends or sell if below.
If this can be done weekly or monthly that would really help me
Indicator is attached for those willing to help.
Attached File(s)
Multiple SMA Trader