Disclaimer. I'll take this down if it offends anyone.
So here is the thought process.
This is what I am seeing currently. I know it isn't a trading plan, but I have to start somewhere.
I posted this warts an all, so feel free to critique.
I just want to see where there are holes in my thought process.
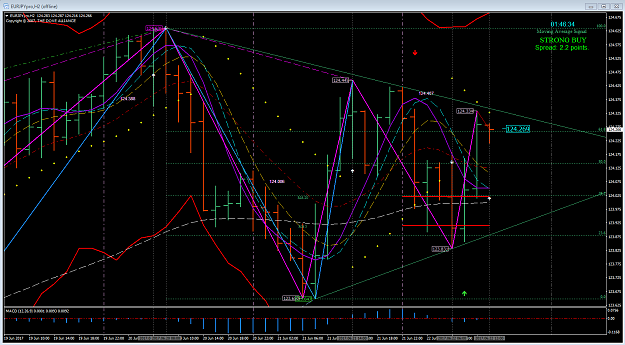
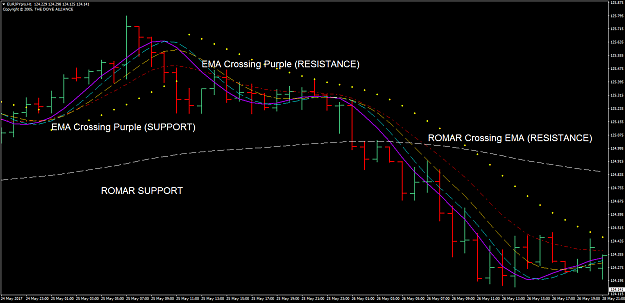
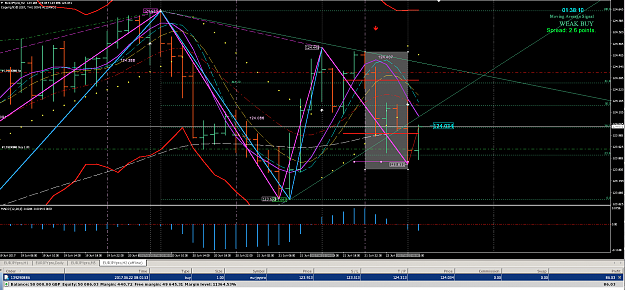
Daily, looking good for up as smooth has crossed ema and I saw that as support along with 38.2 fib parabolic trend up, romar below.
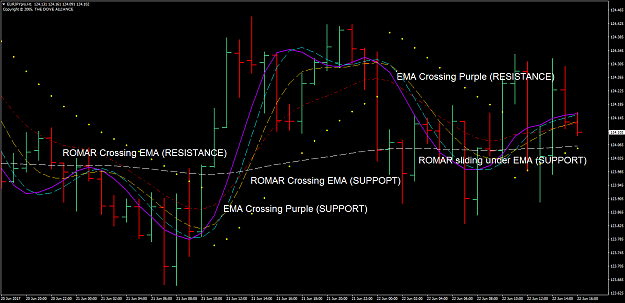
Next up was is the 2 hour chart.
I'm not really happy with the following:
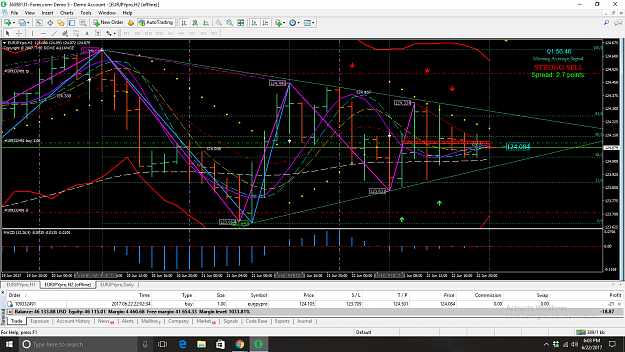
I'm not sure I'm trading from top to bottom as we are in consolidation. Unless of course my entry is the bottom.
Romar was resistant when I entered.
Purple and white had crossed (PB down eliminated), then smooth. So I think, ok 'Ema purple cross is next', and it was (at least I got that right!).
PBs are down.
I'm happy with the following:
(I have smooth in my mind as support on the Daily)
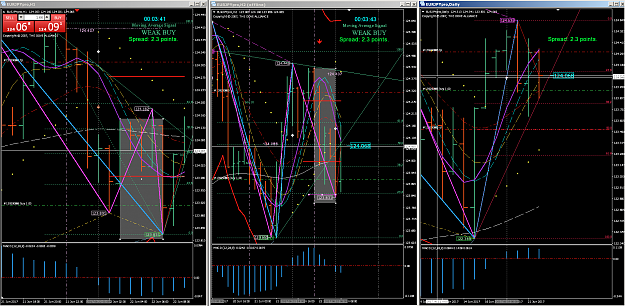
Then I see the 2 hour sar attach, so I mark it out with a tasty little magenta horizontal. And then I think, hang on there is a 23.6 fib here and it is kind of confluent with the attachment of the sar. I worry, 'crap what is stopping it from carrying on down?'. I think it could be that 23.6 fib.
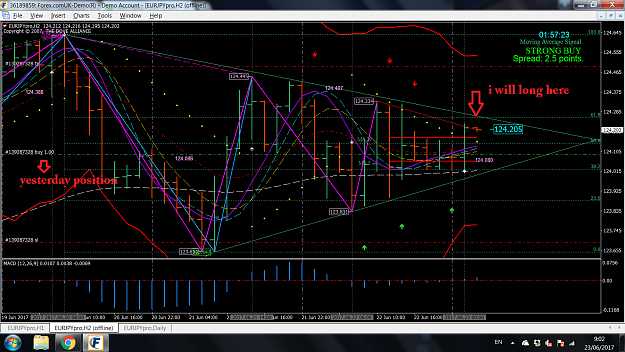
1 hour
Now, I know I'm going to get a telling off for having the sar on my 1 hour, but I ignore it anyway.
What I do notice is the DB has attached, there is gold divergence and we are at zero fib.
I think that purple and white had crossed also eliminating the parabolic for the up. But we have that cross of the 1 hour romar and ema as resistance.
I'm nicely up at the moment, but I know that don't make it right.
I'm fighting the urge to exit the trade at the 2 hour ema, but **maybe** the 2 hour Romar will act as support if the current green candle closes above it nicely.
Or maybe they will just bounce around between them.
Anyway...
Edit, a little more confidence @12.34 (GMT plus 1), as 1 hour purple has crossed smooth. So hopefully good for a hit of Ema.
Edit, @13.27 (GMT plus 1) Self evaluation:+ 40 Although I took the trade and it worked out, there was some uncertainty as I posted above. I still have a lot to learn and this DB and SAR thing is something I know has been holding me back, but the recent posts from Dove and Shinny helped somewhat. Watching how everything interacts on the simulator dove posted was I think a bit of a turning point. That coupled with the basics in the pdf's at the start. I find the screenshots difficult sometimes. Shame some bright spark can't get all 3 charts working on there. Until then I think a screen recorder might be a worthwhile investment.
So here is the thought process.
This is what I am seeing currently. I know it isn't a trading plan, but I have to start somewhere.
I posted this warts an all, so feel free to critique.
Attached Image (click to enlarge)
I just want to see where there are holes in my thought process.
Daily, looking good for up as smooth has crossed ema and I saw that as support along with 38.2 fib parabolic trend up, romar below.
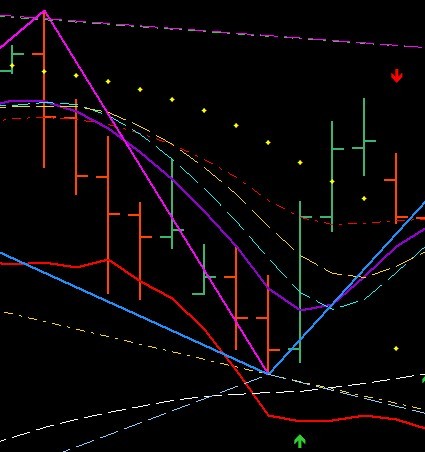
Next up was is the 2 hour chart.
I'm not really happy with the following:
I'm not sure I'm trading from top to bottom as we are in consolidation. Unless of course my entry is the bottom.
Romar was resistant when I entered.
Purple and white had crossed (PB down eliminated), then smooth. So I think, ok 'Ema purple cross is next', and it was (at least I got that right!).
PBs are down.
I'm happy with the following:
(I have smooth in my mind as support on the Daily)
Then I see the 2 hour sar attach, so I mark it out with a tasty little magenta horizontal. And then I think, hang on there is a 23.6 fib here and it is kind of confluent with the attachment of the sar. I worry, 'crap what is stopping it from carrying on down?'. I think it could be that 23.6 fib.
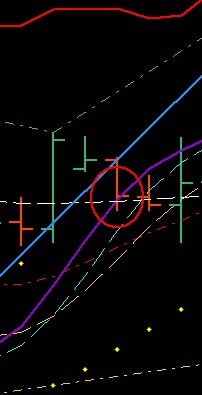
1 hour
Now, I know I'm going to get a telling off for having the sar on my 1 hour, but I ignore it anyway.
What I do notice is the DB has attached, there is gold divergence and we are at zero fib.
I think that purple and white had crossed also eliminating the parabolic for the up. But we have that cross of the 1 hour romar and ema as resistance.
I'm nicely up at the moment, but I know that don't make it right.
Attached Image (click to enlarge)
I'm fighting the urge to exit the trade at the 2 hour ema, but **maybe** the 2 hour Romar will act as support if the current green candle closes above it nicely.
Or maybe they will just bounce around between them.
Anyway...
Edit, a little more confidence @12.34 (GMT plus 1), as 1 hour purple has crossed smooth. So hopefully good for a hit of Ema.
Edit, @13.27 (GMT plus 1) Self evaluation:+ 40 Although I took the trade and it worked out, there was some uncertainty as I posted above. I still have a lot to learn and this DB and SAR thing is something I know has been holding me back, but the recent posts from Dove and Shinny helped somewhat. Watching how everything interacts on the simulator dove posted was I think a bit of a turning point. That coupled with the basics in the pdf's at the start. I find the screenshots difficult sometimes. Shame some bright spark can't get all 3 charts working on there. Until then I think a screen recorder might be a worthwhile investment.
'in less than half an hour he made over 100 ticks'