Hello Traders,
I've been off FF for a few years now, but recently I've gathered enough knowledge to come back with something worth sharing.
This is my TwTL trading (Trade with Trend Lines Channels)
I would say the technique itself looks simple, and drawing the chart is also quite easy, getting into the best trades is something that is not that hard either, while finding the right targets are quite easy. Finding trend turning points are not that simple, but I am trying to work on that. Got a few key signals on that which I'll try to properly explain and show you.
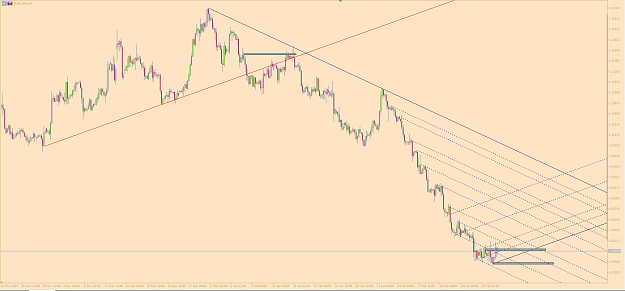
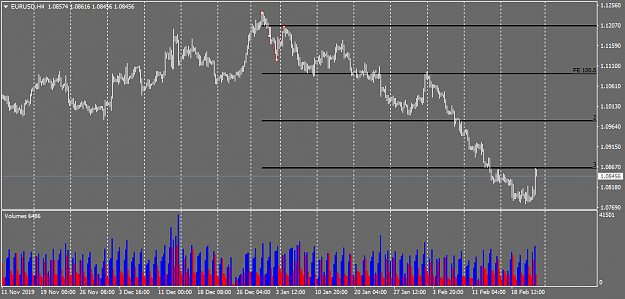
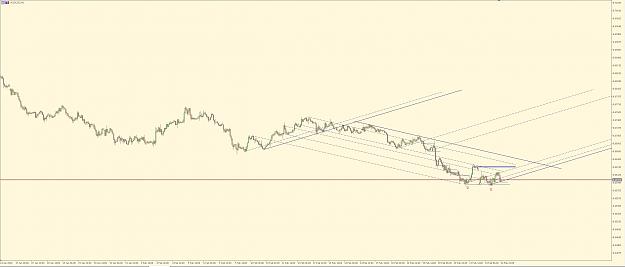
Please check the 1st Screen shot.
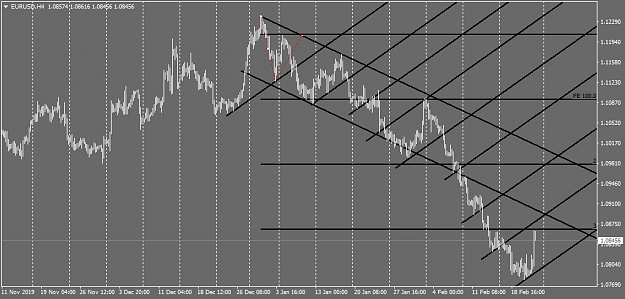
Drawing the down and up trend lines is explained on the screenshot.
Placing them is easy,
Down trend lines goes on the previous up trend "Highs"
Up trend lines goes on the bottom of the previous down trend "Lows"
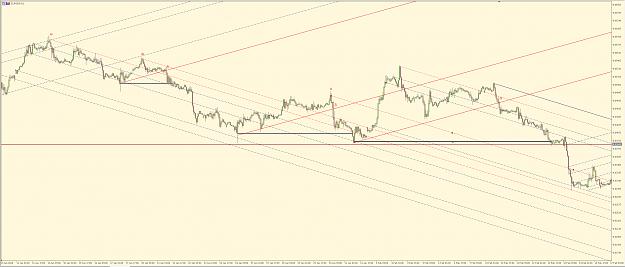
Targets are the previous lows or highs. If there is no furthre reference like at a nice rally. You can use these guide lines to see where the price will go.
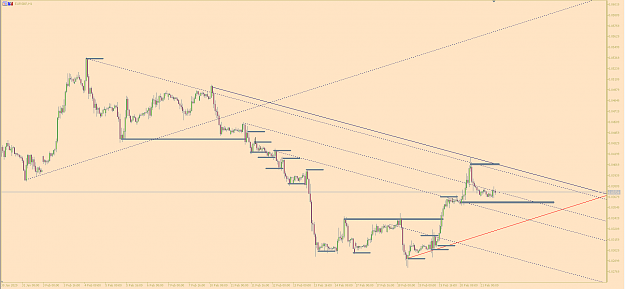
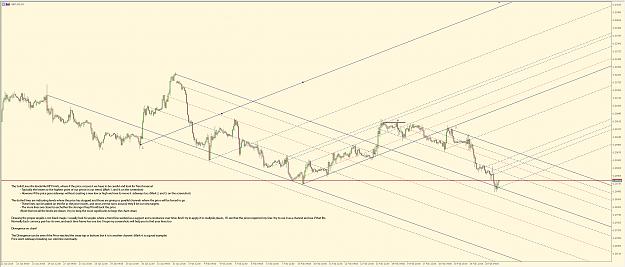
I tried to mark on this screenshot with blue the targets on this trend.
With magenta the absolute tops within a channel.
As you see we have a nice LH LL setup. With this in mind, if you mark your levels, its basically easy to find a nice entry near to the pink levels and aim to the blue lines. If your price does not cross the pink lines but crosses your dotted counter trend lines, you are good to go till your next blue level or to the next support/ resistance level.
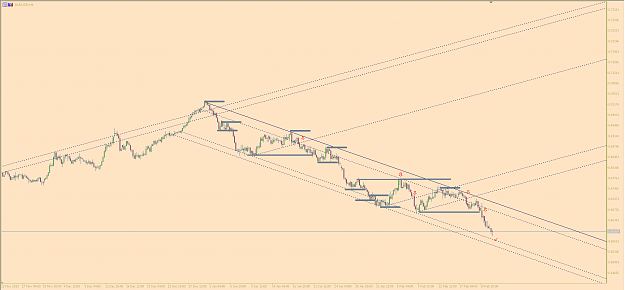
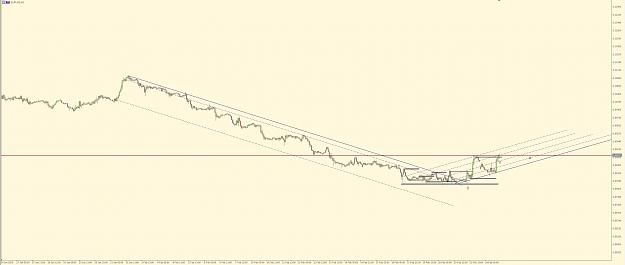
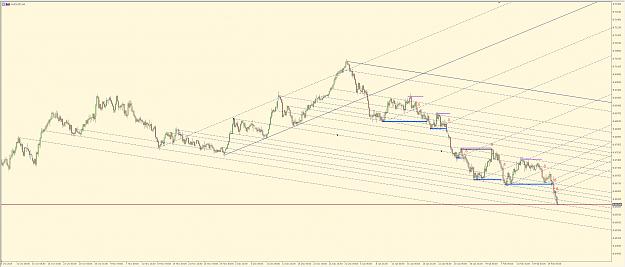
On the 3rd Screenshot, you can see that there were 2 occasions where our new "low's" top was breached. These are those cases where we halt our horses and wait. We have to see where the price goes. It'll be probably a more robust counter move closing to our ultimate solid line. However, we still can add our counter line to the new low like at the circles and see if it gets crossed again, which would confirm that the trend is still on. And the price was just bubble up.
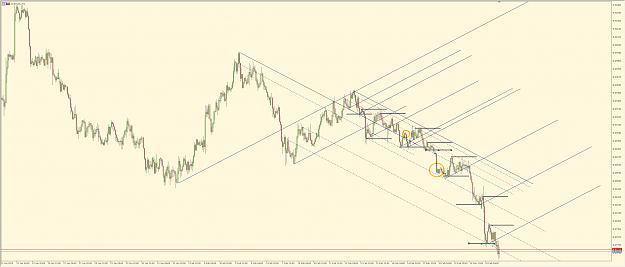
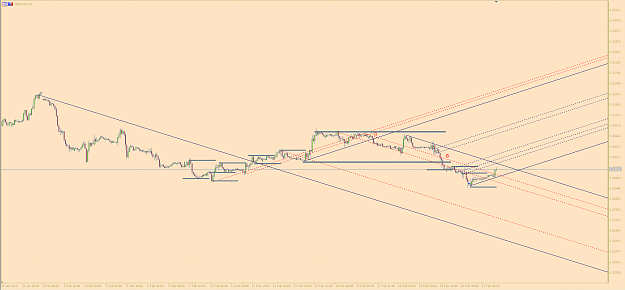
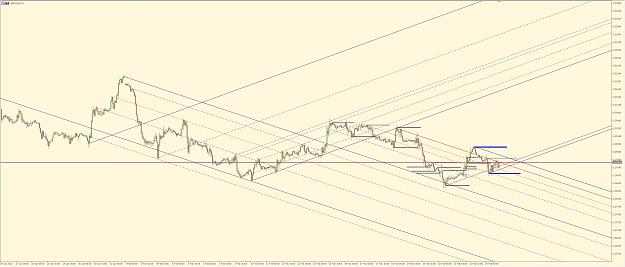
On the 4th Screenshot, you can see the a) b) c) markings, which are old absolute limits. The price eventually broke the Solid red supoprt lines, and that indicated a drop to the previous low as it re-confirmed the trend continuation.
The most recent limits are with solid blue as they still hold.
I'll try to add you more references later on.
Without further detailing and attaching more screenshots, let's see if you have questions, so I can update this post to have good instructions for the new comers.
Cheers
I've been off FF for a few years now, but recently I've gathered enough knowledge to come back with something worth sharing.
This is my TwTL trading (Trade with Trend Lines Channels)
I would say the technique itself looks simple, and drawing the chart is also quite easy, getting into the best trades is something that is not that hard either, while finding the right targets are quite easy. Finding trend turning points are not that simple, but I am trying to work on that. Got a few key signals on that which I'll try to properly explain and show you.
Please check the 1st Screen shot.
Attached Image (click to enlarge)
Drawing the down and up trend lines is explained on the screenshot.
Placing them is easy,
Down trend lines goes on the previous up trend "Highs"
Up trend lines goes on the bottom of the previous down trend "Lows"
Targets are the previous lows or highs. If there is no furthre reference like at a nice rally. You can use these guide lines to see where the price will go.
I tried to mark on this screenshot with blue the targets on this trend.
Attached Image (click to enlarge)
With magenta the absolute tops within a channel.
As you see we have a nice LH LL setup. With this in mind, if you mark your levels, its basically easy to find a nice entry near to the pink levels and aim to the blue lines. If your price does not cross the pink lines but crosses your dotted counter trend lines, you are good to go till your next blue level or to the next support/ resistance level.
On the 3rd Screenshot, you can see that there were 2 occasions where our new "low's" top was breached. These are those cases where we halt our horses and wait. We have to see where the price goes. It'll be probably a more robust counter move closing to our ultimate solid line. However, we still can add our counter line to the new low like at the circles and see if it gets crossed again, which would confirm that the trend is still on. And the price was just bubble up.
Attached Image (click to enlarge)
On the 4th Screenshot, you can see the a) b) c) markings, which are old absolute limits. The price eventually broke the Solid red supoprt lines, and that indicated a drop to the previous low as it re-confirmed the trend continuation.
Attached Image (click to enlarge)
The most recent limits are with solid blue as they still hold.
I'll try to add you more references later on.
Without further detailing and attaching more screenshots, let's see if you have questions, so I can update this post to have good instructions for the new comers.
Cheers