• Home
  • Forums
  • Trades
  • News
  • Calendar
  • Market
  • Brokers
  • Login
  • Join
  • 8:57am
Menu
  • Forums
  • Trades
  • News
  • Calendar
  • Market
  • Brokers
  • Login
  • Join
  • 8:57am
Sister Sites
  • Metals Mine
  • Energy EXCH
  • Crypto Craft

Options

Bookmark Thread

First Page First Unread Last Page Last Post

Print Thread

Similar Threads

MTF Support & Resistance indicator - fine tuning 10 replies

Need help tuning this indicator 2 replies

Fine-tuning an EA 5 replies

Indicator needs fine tuning. Programmers please help 0 replies

Fine tuning Questions for LT users of TD lines 3 replies

  • Trading Journals
  • /
  • Reply to Thread
  • Subscribe
  • 2
Attachments: Digital System Tuning & Optimization
Exit Attachments
Tags: Digital System Tuning & Optimization
Cancel

Digital System Tuning & Optimization

  • Post #1
  • Quote
  • First Post: Feb 5, 2020 8:23pm Feb 5, 2020 8:23pm
  •  JetTrader
  • Joined Apr 2011 | Status: Member | 564 Posts
I have one thread going for Newb Traders. I thought it might be interesting start another thread for Advanced Traders. Specifically, those AT (Advanced Traders) types that use Digital Trading Systems.

I've been using this system for about 1 month in full-time production level trading so far, after working on it with another Forexfactory member who did an outstanding job on the coding side of the project while I handled the design side. The identity of the Forexforum member will remain undisclosed by me and unless that member decides to make their identity known, it will always remain undisclosed by me.

The System is composed of six custom indicators with each one running in its own System Module. Each custom indicator produces its own independent variable driven output in graphic form on the face of the Panel. Each system module outputs for each of the nine (9) MT4 Time Frames. I have not done any extremely long rang bombing missions with this system that would require extensive hold times like multiple months for a single trade, so I don't run the MN1 Time Frame output for the System. Depending on the type of trading I'm doing at the time, I run anywhere from M1 stand-alone all the way to M1 through W1.

Much like a Swiss Army Knife, I can run different trade types by mixing or combining output from a variety of Time Frames. So, I can run M1 with M15, or M1 with D1, or M5 with H4, or H4 with W1, or any number of available combinations - again - depending on the type and kind of trading I'd like to engage that day or that week. It truly is Swiss Army Knife in the sense that I can focus my trades across a never ending variety of types from Scalp all the way up the timeline ladder to full blown Position trades that some would consider "Investing" given the huge event horizon for expected results (like weeks or months away from the entry).

I've only been live trading with the System for about one (1) full month now. The optimization work took months to complete and that produced several different System Configurations that I use depending on the type of trading I'd like to do. The System Configuration possibilities are endless and the Tuning Process of the various System Configurations is tedious work, but has been well worth the effort.

Right now, I have developed four (4) (what I call) RTT System Configurations that I use for actual live trading:

- Alpha
- Bravo
- Charlie
- Standard (Base Config)

These system configurations are actual MT4 .Set files:

Attached Image


Right now, I'm doing some tuning on the Charlie Config. Charlie Configuration is a blend of faster and slower configurations of various components within the System Modules to produce an overall Panel output that I like to use for short term momentum trading. These could be trades that run for anywhere between 5 minutes up to 1 hour. This is compared to the Alpha Configuration where trades might run for 30 seconds up to 10 or 15 minutes max. The Bravo Configuration produces trades that could be over in 1 hour (in a really good day), but that could also run for 1-2 days on average. So, I can tune the System using different Configurations of its variable inputs to produce a specific trade type. Ok, enough of that dry stuff.

I'm interesting in knowing whether or not some of you true blue Digital Trading System types spend a lot of time tuning your systems and whether or not you find the process intuitive. In other words, can you think ahead of the new configuration you want well enough to tune the System and then actually get the reply from the System that you thought you were going to get when the idea was just in your head.

I find the Tuning aspect of a Digital Trading System to actually be more fun than the research, design and engineering phases. I'm curious as to what you think and which phases of Digital Trading System Development did you find more fun or more interesting. Honest, the Research Phase is a total grind and often times a real pain - almost like suffering for me personally. I don't like it much at all, but I realize how important it is to the overall goal of achieving a functional and efficient Trading System. So, I grin and bear the pure Research Phase. Over the years, it just got more and more tough to do given all the tedium involved.

I found the actual Design Engineering Phase(s) to be more fun than the pure Research Phase(s) because it is a bit more, I don't know, "creative" in some ways. Of course, then there are the Testing & Optimization Phases (which go hand-in-hand). I found that kind of work to be fun as well. But, so far, nothing has been more fun outside of actual trading (which is the funnest of all no doubt) than the tuning the System Configurations. I guess I like that part more than the other creative phases because I get to design specific trade types into the System.

So, for all those hard core Systems Designers out there in Forexfactory land, I'm curious as to what your experience has been in pushing raw ideas into a functioning Digital Trading System. Please feel free to comment on your journey below!

Here's a sneak peak on a "Tune-Up" job that I've begun on the TripleStoch system module:

Attached Image (click to enlarge)
Click to Enlarge

Name: Panel Tune-Up TripleStoch Excerpt.png
Size: 86 KB


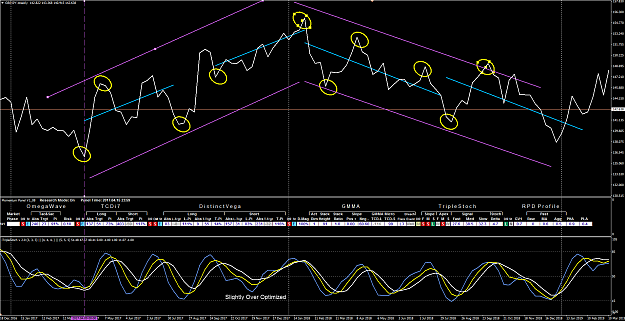
In this pic, I've isolated the W1 TF. I go into the Module (in this case TripleStoch) and tweak the Indicator's inputs based on the kind of market behavior I want to capture and represent inside the Panel. I pick some of the most difficult market terrain on the chart and some of the smoothest market terrain on the chart, and then try to find a happy medium if such an Indicator configuration exists. I then iterate through this process covering a ton of market segments that contain both difficult to navigate terrain and smooth terrain where predicting market behavior was fairly simple to do without the indicator. I combine the two approaches into a single Indicator Tune and then assert that "Tuning" into the Panel by simply editing the System Configuration .Set file.

One of the reasons I find this part so much fun is that I have actually discovered different types of good trade conditions (set-ups) during this type of Tuning process. So, the processing of market tuning has actually produced some trading ideas that I never knew existed before! Quite fun actually when that happens. It does not happen all the time, but when it does and I run the Panel in Research Mode back through history to verify and confirm the new trade type, it really does put a smile on my face.

I'm curious as to how some of you guys do it.
  • Post #2
  • Quote
  • Feb 6, 2020 12:17am Feb 6, 2020 12:17am
  •  LiquidGenius
  • Joined Jan 2014 | Status: Google is a wonderful tool | 130 Posts
For me, I would probably say I've spent the past 5 years in the research phase and not much else (and the year before that wandering around the abyss). Ever since I learned about magnitude/timing/direction/probability, I started looking to build my own indicators to capture each one of these and build a system around it. Eventually, I found that it wasn't that difficult to get a single indicator to do a single thing - ATR as a proxy for magnitude works fine for starters. Moving past that, combining two out of the four was quite doable as well. Market lulls, certain days of the week can encompass future magnitude as well as timing, and it has an element of probability as well. Scalping at a basic level has a direction with high probability as well. The problem with scalping however is its magnitude, or more specifically its MAE magnitude. And this was the kind of problem that I spent years trying to solve.

Putting together indicators to do one or two things was tricky but doable. But I found that trying to add that 3rd or 4th element to be a killer, it was like trying to pull off a balancing act of incredible proportions. In the scalping example, everything works fine when you can catch enough magnitude to get out. But what happens when you can't? I could decrease MAE, but at the cost of probability. It seems to me like some people have figured out a way not to prevent getting into trades when magnitude moves against them, but understand the micro (and macro) structure of these specific scenarios so well that they can get out unscathed, usually by averaging down in a way that seems insane unless you have special insight and execution ability (possibly some more tooling in magnitude/direction/etc in another time frame or expanded view).

While we haven't explicitly defined research vs design and engineering, my problem was basically this: If the criteria of moving an idea from research into design was that it presented something nominal (i.e a scalp setup that has a higher probability than normal, but on the surface looks like it has some issues), then I found a decent number of those ideas. However when it comes to "completing" design or to find solutions to those problems to make them real systems, then I almost never got out of that phase. Finding that special insight seemed like trying to shave a square to fit that round hole, and perhaps that's the secret, but I never really felt like I knew how to approach it in a way that made sense. Perhaps some of it has to do with my lifestyle that doesn't really allow for much manual trading and everything is automated so I've already filtered out anything that would require a "feeling" or in the moment decision, but I've never felt that was in the spirit of this approach to trading.

I did however at some point, end up with a minor system that barely, just barely holds everything together. While I'm not satisfied with it by any means, it does take advantage of an insight I gained that effectively turns the system from null to positive, which is a win for me. I was able to optimize on it slightly, but research remains the largest roadblock for me and I always find myself coming back to the chart wondering how I can put the pieces together.
"Mrrraggglhlhghghlgh"
 
 
  • Post #3
  • Quote
  • Feb 6, 2020 2:43pm Feb 6, 2020 2:43pm
  •  JetTrader
  • Joined Apr 2011 | Status: Member | 564 Posts
Quoting LiquidGenius
Disliked
Eventually, I found that it wasn't that difficult to get a single indicator to do a single thing
Ignored
Bingo! You win the I read in context award for 2020. That's exactly the point and it cuts to the heart of Integrated Trading System Design and defines what makes it different than other types of designs. Everybody is looking for the Grail Indicator - the single Indicator that does all things. The Gawd Indicator! Maybe it does exists, I just haven't found it yet. But, you can rig up a single Indicator that does one thing very well - and then move to the next core component (Timing, Direction or Magnitude) and find another Indicator that fills that need - then the next, then the next. Once you have the three (3) major bases covered (Timing, Direction and Magnitude), you can then begin the integration work of finding synergy between them and determining Probability, the last of the great equalizer component. You then trade Probability. There is nothing else to trade. You allow/trust the System to do what you cannot do - real time calculations at a speed that no human brain can compete with.

This is the essence of how to build an Integrated Trading System. But, this is so far removed form the average Trader, because it involves an enormous amount of time, energy, effort and commitment to complete and most Traders at the Retail level just don't have that much fuel in their desire tank. You really have to feel "called to duty" in order to sustain enough energy to complete such a task. Thus, the reason why so many resign themselves to eventually just giving up, calling it quits and never realizing the goal of an Integrated Trading System. Others typically never get around to understanding even the concept of an "Integrated" Trading System, or what components need to be Integrated.

If the average Trader would just stop and think:

Timing
Direction
Magnitude
Probability

What else is there, really. There is nothing else outside of these components in Trading. Nothing. It is exactly like the set of questions:

Who
What
When
Where
Why
How

Can anyone think of another that can be asked anywhere in the known Universe. No. There are only six (6) questions (just stop and think about that) that can ever be asked about anything in the known Universe. LOL, that's amazing on its face. Very exciting, too! The fact that all you have to do to understand anything in the known Universe is find answers to six (6) fundamental questions is mind blowing when you stop to think about it. Absolutely, mind blowing that only six (6) things stand in your way of knowing everything there is to know. Wow. Just wow. Six. Not six thousand, or six million or six billion or six trillion questions - just six (6). One of those mind bending realities of the known Universe. Every solution to every problem can be far better understood by breaking the problem down into these six (6) components. It is no different in Trading. Thus, Timing, Direction, Magnitude and Probability rule and reign supreme as being everything that encompasses a quality trade.

Quoting LiquidGenius
Disliked
Scalping at a basic level has a direction with high probability as well. The problem with scalping however is its magnitude, or more specifically its MAE magnitude. And this was the kind of problem that I spent years trying to solve.
Ignored
I've found that Scalping can be done best at two different times. One is inside the Apex of a reversing market and the other is inside the Dominant flow of the existing market direction. Scalping at the Apex can be difficult when the timing of the Apex is off. Scalping inside a large Dominant Trajectory during the exhaustion of a lower time frame Subordinate Trajectory carries a larger safety net as a true market reversal that goes against the trade from that point will statistically provide a BE touch point somewhere along the line before the market reversal permanently sets itself and "trend follower" catch on to the new market direction. This is just basic common sense after a while. However, the Apex type of Scalp, entering during the directional shift in a larger time frame, carries more opportunity for profit at the expense of higher risk. So, one has to be really good at consistently doing Apex type Scalps against existing large scale market direction that's imminent for a reversal. This is not common sense and requires real skill to do consistently. I'll be doing some of these in my Live Streaming thread once I get set-up with YouTube and OBS.


Quoting LiquidGenius
Disliked
Putting together indicators to do one or two things was tricky but doable. But I found that trying to add that 3rd or 4th element to be a killer, it was like trying to pull off a balancing act of incredible proportions.
Ignored
That's the Dark Side of Integrated Trading Systems. The more balls in the air, the better a juggling act you need to maintain. The key here is understanding the real relationship between the four (4) components and then relating the differential output from each Indicator into a singular Decision. That's not a skill that can be taught, unfortunately. It is a skill that is developed over time and with experience in Systems Integration. Having a background as an actual Systems Engineer, does not hurt one bit - in fact it helped me tremendously to advance, grow and hone that skill. But, you don't need to have been a former Systems Engineer of any kind. It just requires understanding of the points of integration and then creatively working on algorithms that best combine the output from each one into a singularity (decision). Along these lines, understanding the difference between Indicator Logic and Trade Logic becomes critical. The Indicator has its own logic (math, functions, logical wrappers, etc.). The Trade has its own logic (mostly algorithmic integration of Indicator output into a final decision). The creative part comes in the way in which you connect the two ideas into a theoretical systematic approach to the trade itself. Then there is the testing, tweaking, optimization and finally deployment into the real market.

And, some people wonder why it takes so long to build one of these things! It is a ton of work, that's why! And, it ain't easy. There is no Easy Button to press here. My old saying is that trading does not become easy until you put in the work to make it easy. One way or another, you will work your ass off until you become Competent. Whether a systems approach or a manual approach, one will work their butt off to develop real skill, knowledge and expertise. And, even then, there are no promises. You have to be ruthlessly consistent in your trading on purpose and without quitting. There is no other way around it. Those who persist, correct their errors and redeploy capital to the market eventually win. Its always been that way.

You don't have to be a PhD in Engineering, Math or Physics. You do need a PhD in Persistence. Unending and undying Commitment to the Craft of Trading. That is the mindset that results in long term success and breaking through the barriers of consistent error prone trading which destroys account balances over time.


Quoting LiquidGenius
Disliked
While we haven't explicitly defined research vs design and engineering, my problem was basically this: If the criteria of moving an idea from research into design was that it presented something nominal (i.e a scalp setup that has a higher probability than normal, but on the surface looks like it has some issues), then I found a decent number of those ideas. However when it comes to "completing" design or to find solutions to those problems to make them real systems, then I almost never got out of that phase.
Ignored
Its because this is not easy. If it were easy, everybody and their pet hamster would be doing it. How many Quants are there out there who have tried and failed AND were hired by funds to build the algos that do the trading. So, if a Quant with a PhD in Mathematics fails - hell - the rest can expect failure as a normative function of the process of building an Integrated Trading System. This is why Persistence is the final solution, ultimately. The race is not always given to the highest IQ in the room. The race is a marathon. Those who endure to the end are typically those who ultimately discover their breakthrough.

Research, is the physical act of searching the history of market data for patterns in Price Action. How one conducts that level of research will determine a lot about the type of trading system they ultimately develop. I began over 20 years ago by exploring raw OHLC data in an Excel spreadsheet. I loaded rows of OHLC in a blank spreadsheet with nothing else and began asking myself questions about that data and nothing else. I did not start by throwing Indicators on a chart, trying to understand the Indicators output. I began with raw data, trying to understand the relationship between OHLC in each row and WHY (who, what, when, where, WHY and how) that data changed over time.

So, the fundamental nature of my research was not to find out where the market was going next. It was to find out WHY there were Deltas (changes) between the four (4) data points (OHLC) in each row. That's the approach of a Quant who is trying to find answers to questions at a much lower level than the rest of the market. So, when you are seeking answers to questions at lower levels in the market data, you will find relationships that most Traders don't see - simply because they have not explored market data in the same way. It is not rocket science, just a different approach to that kind of Research. This is what I call Core Research. It does not get any lower than the raw OHLC data in a spreadsheet. A High Frequency Quant will dig deep into the Tick Data, which sits below the OHLC. OHLC is a direct derivative of Tick.

The lower the level of Research, the more insight into Market Behavior you get as a direct result. At some point, you develop a neural network in your brain (literally, not figuratively - this is actual neuroscience) that's able to understand and interpret market data at the level of OHLC. No different than in the old days when Floor Traders had neural nets in the brain that helped them understand the Tape. OHLC in a spreadsheet was my "Tape." So, I developed an ability to understand the language of raw OHLC and what it was saying at that level of market expression. Then, I struck out and began developing bespoke Indicators. This is what made my Indicators unique and different. They came into existence because of a different approach to "Research."

Its like food. You are what you eat. Ergo, your Trading System is what you Research. The rest comes from years of growing and developing more skill at seeing relationships in the data and then developing Indicators that reflect or expose those relationships in digital form (Derived Indicator Output). Once the Indicator begins to consistently express the truth about the underlying market data, you then have something you can formalize or a design you can then freeze and begin deploying in tests. If that version of the Indicator does what it is supposed to do, what it was designed to do - then you can pack it up, give it a version number and move on to the next idea (back to Core Research).

This is a high iterative process that has absolutely nothing to do with trading and everything to do with discovering Market Behavior. All an Indicator needs to do is truthfully express the behavior of Market Data. The "Indicator" does not trade anything. That's not its job. It only serves the purpose of Expression. This is a salient point that a lot of Traders miss, unfortunately. They are looking for the Indicator to do something with their money. That's not the purpose of an Indicator. The purpose of the Indicator is to express market data dynamics outwardly - period. It is up to the Trader to learn how to best interpret that outward expression. That interpretation can then be used in a Manual approach to trading, or in an Automated approach to trading.

It all begins with the approach taken to understanding the Data. If I were a Teacher of Trading Systems Design (I'm not), my first few courses would have absolutely nothing (zero) to do with the act of Trading. My students would first learn Core Data Research. They would become experts at Data Analysis before becoming expert at anything else. The would become experts at understanding the Delta between Data Points in the OHLC stream and HOW (who, what, when, where, why and HOW) to interpret those Deltas. At some point, they would clearly recognize that continuously repeating patterns exist in the data in all time frames. And, that the structure of the market exists within the boundaries of these continuously repeating patterns. And, that there is no market (at all) that exists outside of this Structure.

Walk into any Fortune 100 or Global 50 company anywhere in the world. When you walk into their Data Center and gain access to their ERP, CRM, SFA, R&D, Accounting, etc., via their DW (whether cloud based or not) and begin exploring their data - you will eventually come to understand almost everything there is to know about how that business operates, why it succeeds and/or why it fails. Its all in the Data. The life blood of every company or business model is the Data.

So, if an Indicator's output is not in-line with the idea or concept first contemplated, then revisiting the math and the logic used to construct the Indicator and then asking WHAT (who, WHAT, when, where, how and WHY) was the original expectation and WHY is that expectation not being expressed. This will lead to one of two possibilities:

A) The Indicator's core design (math/logic) lacks sufficient probe to uncover, reveal and express the original expectation
B) The original expectation is somehow not representative of actual patterns that truly exist in the market (a Core Research problem)
C) The forward interpretation being made about the Indicators output is not representative of the original concept and/or idea
D) The math/logic is sound. The output is accurate. But, the Indicator itself is limited in scope and ability (accept its limitations and move on)

Either way, the solution will quite evident the more you troubleshoot the problem. Again, this is the hard ass iterative work that must be done to give birth to an Integrated Trading System. This ain't no picnic, as I am sure you well understand. And, the approach to Core Research is super important to final outcome as well as the forward looking insight obtained.


Quoting LiquidGenius
Disliked
I was able to optimize on it slightly, but research remains the largest roadblock for me and I always find myself coming back to the chart wondering how I can put the pieces together.
Ignored
It is skill and knowledge developed over time resulting in a certain degree of expertise leading to a method of trading the markets that works for you. There is more than one way to skin the kitten without being swallowed whole by the sharks (mixing my metaphors on purpose). One can take what they have learned from researching technical trading system design and without using a "Trading System" to execute trades, do manual Price Action based trading and do quite well at it. Else, if an Integrated Trading System is the goal, then going through the highly iterative process of Research & Discovery will be something that one must commit themselves to enduring. The latter is grueling work, no doubt. But, if an Integrated Trading System is sought, this is the price one has to pay.

Hope this helps and successful trades.
 
 
  • Post #4
  • Quote
  • Feb 6, 2020 11:36pm Feb 6, 2020 11:36pm
  •  LiquidGenius
  • Joined Jan 2014 | Status: Google is a wonderful tool | 130 Posts
Thanks for such an in-depth response. I've come to a lot of the same conclusions trying a lot of these things through the years so it's great to hear that it seems like I'm on the right track.

Quoting JetTrader
Disliked
{quote} A) The Indicator's core design (math/logic) lacks sufficient probe to uncover, reveal and express the original expectation
B) The original expectation is somehow not representative of actual patterns that truly exist in the market (a Core Research problem)
C) The forward interpretation being made about the Indicators output is not representative of the original concept and/or idea
D) The math/logic is sound. The output is accurate. But, the Indicator itself is limited in scope and ability (accept its limitations and move on)
Ignored
This is interesting and something I'll mull over for a while. When I discarded hundreds of ideas and indicators, a question I always thought "if this new indicator is a great predictor of direction, it should be immediately obvious through testing". I later wondered if it was something that I should have continued to develop to try to and increase the indicator's success, rather than move onto something else. These possibilities help me put indicators into one of these categories, rather my model of "good or not good".
ex. I wondered if perhaps instead of one direction indicator which I would have to juggle with one magnitude indicator and one timing indicator if what I really needed was three, five, or more direction indicators that have to be complementary themselves (and to later build the other indicators in this fashion as well). It would seem to be the case because why else would you have so many modules? heh. I tried this approach sparingly by attempting to build a layered magnitude indicator accounting for multiple "time frames" (since we know the time frame really just means more data), using your idea of fill % from ages ago to see if I could see magnitude being "passed" from one frame to another but didn't have much luck getting it to meet criteria A of expressing my original idea. I think viewing these scenarios through these filters will give me more options and have a playbook of knowing what to try after initial failure.
Thanks!
"Mrrraggglhlhghghlgh"
 
 
  • Post #5
  • Quote
  • Last Post: Edited 6:30am Feb 7, 2020 12:07am | Edited 6:30am
  •  BWilliam
  • Joined Jan 2020 | Status: Member | 2,281 Posts
It took me 24/7 8years fiddling with indicators to correctly fit them for them to be useful, real hard work to go through the possible permutations iteration. Breakthrough came when I correlated one aspect of analysis with another, eg magnitude with direction. Just pure luck drop from the sky during my research work that opened up a huge spectrum of integrated system that's previously unknown. The usual error with indicator usage is to use these tools as standalones rendering them useless. The historicity of whatever tool is useful only when the tools are correlated in the first place else the study merely generates some random data with no interpretation value.
Trade the value
 
1
  • Trading Journals
  • /
  • Digital System Tuning & Optimization
  • Reply to Thread
0 traders viewing now
Top of Page
  • Facebook
  • Twitter
About FF
  • Mission
  • Products
  • User Guide
  • Media Kit
  • Blog
  • Contact
FF Products
  • Forums
  • Trades
  • Calendar
  • News
  • Market
  • Brokers
  • Trade Explorer
FF Website
  • Homepage
  • Search
  • Members
  • Report a Bug
Follow FF
  • Facebook
  • Twitter

FF Sister Sites:

  • Metals Mine
  • Energy EXCH
  • Crypto Craft

Forex Factory® is a brand of Fair Economy, Inc.

Terms of Service / ©2023