• Home
  • Forums
  • Trades
  • News
  • Calendar
  • Market
  • Brokers
  • Login
  • Join
  • 3:40pm
Menu
  • Forums
  • Trades
  • News
  • Calendar
  • Market
  • Brokers
  • Login
  • Join
  • 3:40pm
Sister Sites
  • Metals Mine
  • Energy EXCH
  • Crypto Craft

Options

Bookmark Thread

First Page First Unread Last Page Last Post

Print Thread

Similar Threads

Elliott Wave Trading by Ayax 1,991 replies

Elliott wave trading 94 replies

elliott wave trading channel 22 replies

Group Trading based on Elliott wave and Harmonics 0 replies

Elliotters..Elliott Wave Trading 9 replies

  • Interactive Trading
  • /
  • Reply to Thread
  • Subscribe
  • 6,139
Attachments: Elliott Wave Trading
Exit Attachments
Tags: Elliott Wave Trading
Cancel

Elliott Wave Trading

  • Last Post
  •  
  • 1 273274Page 275276277 457
  • 1 Page 275 457
  •  
  • Post #5,481
  • Quote
  • Nov 25, 2012 8:59am Nov 25, 2012 8:59am
  •  infinitus
  • Joined Jun 2010 | Status: s = k log W | 20,603 Posts
Quoting Ian Copsey
Disliked
Great to see you trying it out! I think if you look at the first move higher ending just below where you have Wave A and call that lower high Wave (i) and then after an expanded flat the Wave (ii) you may find the projections easier to work out... My basic view is bullish in the larger wave degree and thus within the weekly outlook you have to decide what the outlook is and understand how to fit in a 5-wave move, what it will take etc.

I'd thoroughly recommend instead of those lines on the chart that you download the HEW spreadsheet from my...
Ignored


Hi Ian,


thank you very much for your response. I had much fun reading your book. Was worth the money :-)

Right now I have to pay attention that I do not confuse the techniques. Constantly I try to count extensions LOL


Ian, I have a hard time to understand the following:

The waves are fractal. When I have an 1-2-3-4-5 impulse in traditional EW, than the fractal nature is easy to understand. 1-3-5 do consist out of 1-2-3-4-5 again. And so on.

But what about Harmonic EW? OK, we have an 1-2-3-4-5 impulse, too. But each of the actionary waves 1-3-5 consists of an A-B-C move.

When we start to think this further, we would get a strange fractal behavior, kind of alternating fractal. What do I mean:


let us look at the first impulse 1-2-3-4-5 (why is here a 5 wave and not an ABC)

now zoom into wave 1: we get A-B-C (where is the 5 wave structure) (only in substructures)

now zoom into wave A: we get A-B-C (where is the 5 wave structure) (only in substructure)


But that contradicts.


Maybe I am too confused right now with fractal behavior. But it all boils down to the question: at what wave degree there can be a 5 wave impulse and where not?

When we assume the system to be fractal, then each actionary wave should also be 5 wave (or we build a fractal system with only 3-wave moves). In no logical way we can assume a 5 wave move but the fractals of it to be only 3 wave moves.

The core question:

with what logic and on what timeframe we are looking for 5 wave moves?

With HEW we are forced to look at a specific time for a 5- wave move, don't we?


Well, we certainly may deny the fractal behavior of waves, but then we must be able to define the TF where the structure is 5 wave and where ABC


But when I read the intro of your web page correctly you too belief in the fractal nature.


Maybe it is hard to understand what I mean. I hope you do :-)


Second question:

You wrote, that the traditional Elliott waves seldomly reach the ideal fib-relations/targets. That is true from my experience too.

But when I look now at your extensions, there are only few fib numbers involved, too. Would it not be possible to gain similar results with "modified" fib-levels in traditional Elliott wave, too?


Lately I have dug deep into wave relationships. I found the work of Swannel quiet enlightening (see attached).

When I see your work and your levels, the levels I have found myself, the traditional levels, the work of Swannel, one comes to the conclusion, that it all boils down to the assumption, that it is not possible to forcast the exact end of a move. There are simply too many levels involved which are high probability retracement levels(zones).

But which of all this levels to chose, day in day out, with a high grade of reproducibility and confidence, that is beyond of my imagination.

When I remember correctly, fibs did not play a big rule in the beginning of Elliott works. It was baked in later.


When I started with Elliot wave years ago, I thought it was a tradeable system in itself. But in leveraged trading that simply does not work. I can say: I failed miserably. When I got early into an impulsive move I felt like the king of traders, but often enough my gains melted away in corrections or complex corrections.

I was only able to make a profitable system in combining EW with other methods.


Well, we can clearly see 5-wave moves in the market. But when we assume in HEW, that all the moves are fractal, and we are speaking generally of ABC corrective moves, then shouldn't we be on the way to claim,


that HEW works with only 3-wave moves? In this case we would have to label a toping wave 5 as kind of B-wave of an ABC-flat.

Doing it in this way would lead again to a fractal nature of HEW, which out of my sight the actual HEW not is (due to the discrepancy in 5-waves moves and 3 wave moves).


At least I have to think about that a bit longer :-)


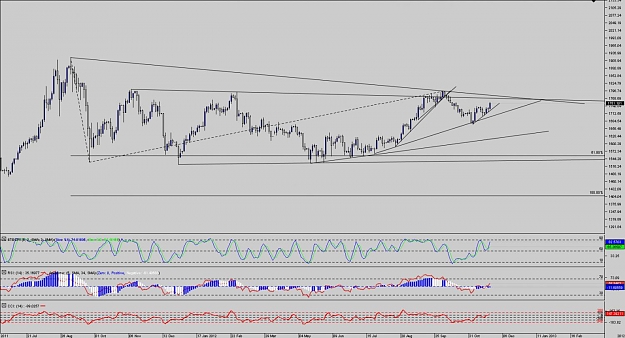
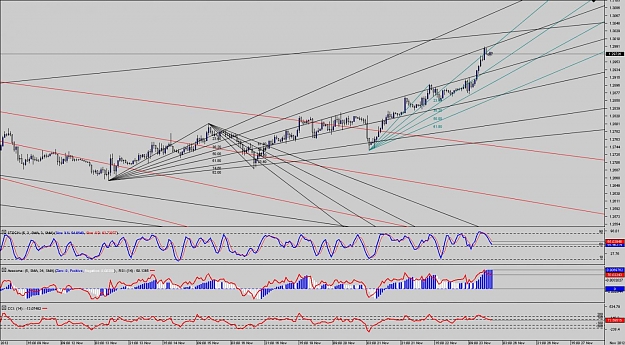
Here, last but not least, my modified count. Since I am not bullish (yet), my main count is that of an ABC-flat (blue) to the upper side.

Price has reached a nice clusterfield of wave C expansions. Out of my feeling now price should stop here or at max 3010-3020 former b), because when it goes higher we have a higher probability, that this is not wave C of the blue ABC-flat, but the whole move may develop into an impulsive move where we are now in wave 3.


OK, let us think bullish: we are in my alternate count of blue 1-2-3-4-5 up. Now at/near the end of wave 3 blue.

When we assume a max target for this recent wave up of 3021, then I got ideal retracement for wave 4 between 1.2958 and 1.2925.

Wave blue 2 is a flat correction, which C wave retraced less than 50%, but its A wave retraced more than 70%. Well, that leaves us guessing regarding alternation LOL


Wave 2 was complex, so we may see here only a zigzag, or in light of the pending Greece decision a sideways pattern like a triangle.


My Murey Math gives 2955 to 2940 ideally for this scenario. But risk is towards 2909 right now (or with Ian#s table 2912)


Trading conclusion:


best place to short was around 2985-2990 with risk at 3021.

Chance is ideally 2955 to 2940. When you short right here, R:R is bad, because of around 50pips risk and 25-50 pips return.


Conclusion:

short with SL right above the recent top, with TP 2960, 2945 and rest at will (with SL at BE)

if stopped out, watch 3020 to eventually reshort again with SL behind 3070.


Set money management accordingly.


Jan, many thanks for your Excel table. I found it a few days ago. Great tool :-)


Jan, one last question:


the retracement and expansion levels you use: have you obtained them via your observations, or are the obtained via statistical program? All I know right now is: they work very well


Catch you later, Markus
Attached Image (click to enlarge)
Click to Enlarge

Name: Chart_EUR_USD_Hourly_snapshot.jpg
Size: 156 KB
 
 
  • Post #5,482
  • Quote
  • Nov 25, 2012 10:40am Nov 25, 2012 10:40am
  •  o man
  • | Membership Revoked | Joined Oct 2011 | 42 Posts
Attached Image (click to enlarge)
Click to Enlarge

Name: elliott.gif
Size: 15 KB


fx5macd
 
 
  • Post #5,483
  • Quote
  • Nov 25, 2012 11:15am Nov 25, 2012 11:15am
  •  shaukat113
  • | Commercial Member | Joined Jul 2011 | 639 Posts
My forex harmonic system
Attached Image (click to enlarge)
Click to Enlarge

Name: no8.gif
Size: 28 KB
just live a life, don't be hard.
 
 
  • Post #5,484
  • Quote
  • Nov 25, 2012 11:19am Nov 25, 2012 11:19am
  •  infinitus
  • Joined Jun 2010 | Status: s = k log W | 20,603 Posts
Quoting o man
Disliked
Attachment 1086801


fx5macd
Ignored


careful, there is so much momentum in your wave 5, that it is more likely to be the wave 3 of a 3 (point of recognition)
 
 
  • Post #5,485
  • Quote
  • Nov 25, 2012 11:21am Nov 25, 2012 11:21am
  •  infinitus
  • Joined Jun 2010 | Status: s = k log W | 20,603 Posts
Quoting shaukat113
Disliked
My forex harmonic system
Ignored


very nice :-)
 
 
  • Post #5,486
  • Quote
  • Nov 25, 2012 11:58am Nov 25, 2012 11:58am
  •  shaukat113
  • | Commercial Member | Joined Jul 2011 | 639 Posts
Can I post Ian Excel table file? or it is not permitted.
just live a life, don't be hard.
 
 
  • Post #5,487
  • Quote
  • Nov 25, 2012 1:02pm Nov 25, 2012 1:02pm
  •  shaukat113
  • | Commercial Member | Joined Jul 2011 | 639 Posts
I am new in Elliott wave and harmonic, but I found some thing interesting Ian Excel table in gold. it says in impulsive wave 2 wave (v) 50% projection 1679.82, 58.60% projection 1751.07, 61.80 projection 1777.58.

If am not wrong (I hope I am not) than we are going to see gold at 1777.58 in near future. the gold is return from 1676 and Friday close is 1750.23.
I have a question. when price reach these fib ratio (for example in this case )i.e 58.60%, 61.80%, 66.70% can we expect pull back. I means can we see pull back in gold at 1751, than at 1777 and at 1818. or we can see a major down side at 61.80% i.e 1777.
just live a life, don't be hard.
 
 
  • Post #5,488
  • Quote
  • Nov 25, 2012 1:20pm Nov 25, 2012 1:20pm
  •  infinitus
  • Joined Jun 2010 | Status: s = k log W | 20,603 Posts
Quoting shaukat113
Disliked
Can I post Ian Excel table file? or it is not permitted.
Ignored


I think you should simply put the link to his homepage here with the site containing the download link :-)
 
 
  • Post #5,489
  • Quote
  • Nov 25, 2012 1:47pm Nov 25, 2012 1:47pm
  •  Nobitacu
  • Joined Jul 2007 | Status: Just Another Trader | 836 Posts
Hello everyone,

A brand new HEW trader wanabe here. I too have been trading the Elliott and felt there's always something missing. Currently I'm using Stoch as how George Lane uses it, and RSI as my final confirmation for entrance, but even better if I can somehow predict where the end of a wave might happen. It will be a bit odd however for me to count 3 waves instead of 5 as I've grown used to, but from some of my early understanding so far, within A, B, C, it is still a 5 wave structure, so it should work out fine.
 
 
  • Post #5,490
  • Quote
  • Nov 25, 2012 1:50pm Nov 25, 2012 1:50pm
  •  Nobitacu
  • Joined Jul 2007 | Status: Just Another Trader | 836 Posts
Quoting Ian Copsey
Disliked
There are an awful lot of overlapping 1's and 4's there... Any reason?
Ignored
I was wondering the same thing when I saw that chart and its wave structure. :S
 
 
  • Post #5,491
  • Quote
  • Nov 25, 2012 2:41pm Nov 25, 2012 2:41pm
  •  infinitus
  • Joined Jun 2010 | Status: s = k log W | 20,603 Posts
Quoting shaukat113
Disliked
I am new in Elliott wave and harmonic, but I found some thing interesting Ian Excel table in gold. it says in impulsive wave 2 wave (v) 50% projection 1679.82, 58.60% projection 1751.07, 61.80 projection 1777.58.

If am not wrong (I hope I am not) than we are going to see gold at 1777.58 in near future. the gold is return from 1676 and Friday close is 1750.23.
I have a question. when price reach these fib ratio (for example in this case )i.e 58.60%, 61.80%, 66.70% can we expect pull back. I means can we see pull back in gold at 1751, than...
Ignored


Hi Shaukat,


to EW count Gold at the moment it is a futile thing.

I have several projections with targets around the 1770 level + incoming trendlines (1770 and 1780)
Attached Image (click to enlarge)
Click to Enlarge

Name: Chart_XAU_USD_2 Days_snapshot.jpg
Size: 145 KB
 
 
  • Post #5,492
  • Quote
  • Nov 25, 2012 3:18pm Nov 25, 2012 3:18pm
  •  Ian Copsey
  • | Commercial Member | Joined Nov 2010 | 447 Posts
Quoting shaukat113
Disliked
I am new in Elliott wave and harmonic, but I found some thing interesting Ian Excel table in gold. it says in impulsive wave 2 wave (v) 50% projection 1679.82, 58.60% projection 1751.07, 61.80 projection 1777.58.

If am not wrong (I hope I am not) than we are going to see gold at 1777.58 in near future. the gold is return from 1676 and Friday close is 1750.23.
I have a question. when price reach these fib ratio (for example in this case )i.e 58.60%, 61.80%, 66.70% can we expect pull back. I means can we see pull back in gold at 1751, than...
Ignored
If this table is from a report that has not been published as an example I would request that details are not disclosed as they are subject to copyright. If it is from my website then it's extremely old and does not reflect current wave counts.

However, Gold has been developing as I suggested in last week's report and yes, as it happens I am looking for a high around 1,770 ... but I sense this may be a coincidence more than anything else.

Infinitus, EW may fail and I don't get everything right, but at the moment Gold has been developing in HEW terms. With all due respect, and I hope you don't mind me saying, but those trend lines are not valid trend lines as there is no trend... The definition of trend is higher highs and higher lows and vice versa... I always work on the requirement that before a trend line is valid it must have at least 3 touches. If it does not, then the risk of break is very high.


I shall respond to your points about EUR later... I have to get back to work!
No I haven't got the wave structure wrong! I've corrected it!
 
 
  • Post #5,493
  • Quote
  • Nov 25, 2012 4:01pm Nov 25, 2012 4:01pm
  •  infinitus
  • Joined Jun 2010 | Status: s = k log W | 20,603 Posts
Quoting Ian Copsey
Disliked
If this table is from a report that has not been published as an example I would request that details are not disclosed as they are subject to copyright. If it is from my website then it's extremely old and does not reflect current wave counts.

However, Gold has been developing as I suggested in last week's report and yes, as it happens I am looking for a high around 1,770 ... but I sense this may be a coincidence more than anything else.

Infinitus, EW may fail and I don't get everything right, but at the moment Gold has been developing...
Ignored


Hi Ian,

thanks for response,


maybe I was kind of unclear regarding Gold:

we may call such lines "reactionary" lines, since price most of the time reacts on them, maybe in form of an outright reversal or sometimes only for a retracement.

My view is, that those lines are valid points to watch, because price had a reason at those touching points to return.

Take, e.g. EW base channels. They are highly valid most of the time, construed out of only two touching points. Look at the following chart - I called it "Journey to Africa"


Look at the various channels and trendlines. All of them were drawn with only two touches at the time being. Who has followed me on my blog or at my Thread Shangri-La knows this chart now for over 2 years :-)

We have to accept that those lines eventually gets broken, but in this case we can at least nearly everytime bet on a retest of them.


As a trader most of the time I can simply not afford to only wait for trend-lines with 3 touches. I watch momentum and momentum distributions on such lines very closely and draw my decisions.


Patiently waiting for more of your response :-)


Have a nice start in the new week,


Markus
Attached Image (click to enlarge)
Click to Enlarge

Name: Chart_EUR_USD_Weekly_snapshot.jpg
Size: 115 KB
 
 
  • Post #5,494
  • Quote
  • Nov 25, 2012 4:26pm Nov 25, 2012 4:26pm
  •  infinitus
  • Joined Jun 2010 | Status: s = k log W | 20,603 Posts
Working with fib-fans
Attached Image (click to enlarge)
Click to Enlarge

Name: Chart_EUR_USD_Hourly_snapshot.jpg
Size: 178 KB
 
 
  • Post #5,495
  • Quote
  • Nov 25, 2012 4:45pm Nov 25, 2012 4:45pm
  •  Ian Copsey
  • | Commercial Member | Joined Nov 2010 | 447 Posts
Markus

Thanks for the questions. I have provided some responses. I've placed my responses in capitals (no I'm not shouting!) and in blue to make it easier to see them.

The waves are fractal. When I have an 1-2-3-4-5 impulse in traditional EW, than the fractal nature is easy to understand. 1-3-5 do consist out of 1-2-3-4-5 again. And so on.

But what about Harmonic EW? OK, we have an 1-2-3-4-5 impulse, too. But each of the actionary waves 1-3-5 consists of an A-B-C move.
CORRECT

When we start to think this further, we would get a strange fractal behavior, kind of alternating fractal. What do I mean:
let us look at the first impulse 1-2-3-4-5 (why is here a 5 wave and not an ABC)
5-WAVES WILL ONLY EVER CREATE WAVE A OR WAVE C

now zoom into wave 1: we get A-B-C (where is the 5 wave structure) (only in substructures)
now zoom into wave A: we get A-B-C (where is the 5 wave structure) (only in substructure)
I THINK THERE WAS A MISUNDERSTANDING IN WHAT I SUGGESTED WAS WAVE (i) SEE THIS CHART:

http://i1079.photobucket.com/albums/...SDfractals.png

But that contradicts.
HOPEFULLY YOU SEE NOW THERE IS NO CONTRADICATION

Maybe I am too confused right now with fractal behavior. But it all boils down to the question: at what wave degree there can be a 5 wave impulse and where not?
I SHOULD POINT OUT THAT SO FAR YOU HAVE MADE NO MENTION OF IDENTIFYING WAVES THROUGH RATIOS. YOU CAN SEE FROM THE CHART ABOVE THAT DEEP WAVE B’S CAN MAKE WAVES LOOK DIFFERENT TO WHAT THEY ARE. IT IS VITAL THAT MEASUREMENTS ARE MADE…

When we assume the system to be fractal, then each actionary wave should also be 5 wave (or we build a fractal system with only 3-wave moves). In no logical way we can assume a 5 wave move but the fractals of it to be only 3 wave moves.
WHY IS THAT? THINK OF THE DOW THEORY…
SEE THE FOLLOWING VIDEOS ON HEW THAT PROVIDES INFO ON FRACTALS – AND ALTERNATION. I SUGGEST YOU LOOK AT THE INTRO VIDEO AT THE TOP LEFT OF MY BLOG THAT DESCRIBES HOW I FEEL ELLIOTT MAY HAVE INTRODUCED EXTENSIONS BY MISTAKE. WE ARE ALL COUNTING 5-WAVE MOVES. I AM JUST RE-ORGANISING THEM INTO DIFFERENT 3-WAVE GROUPINGS AND YOU’LL SEE HOW CONSISTENT THE PROJECTIONS ARE ACROSS ALL WAVE DEGREES

http://harmonicelliottwave.blogspot....h/label/Videos

The core question:

with what logic and on what timeframe we are looking for 5 wave moves?
THERE IS NO TIME FRAME TO WAVES… THEY CAN BE TERRIBLY SLOW, THEY CAN DEVELOP EXCEPTIONALLY QUICKLY

With HEW we are forced to look at a specific time for a 5- wave move, don't we?
WE ARE NOT…

Well, we certainly may deny the fractal behavior of waves, but then we must be able to define the TF where the structure is 5 wave and where ABC
I HAVE COVERED THIS ABOVE

But when I read the intro of your web page correctly you too belief in the fractal nature.


Maybe it is hard to understand what I mean. I hope you do :-)


Second question:

You wrote, that the traditional Elliott waves seldomly reach the ideal fib-relations/targets. That is true from my experience too.

But when I look now at your extensions, there are only few fib numbers involved, too. Would it not be possible to gain similar results with "modified" fib-levels in traditional Elliott wave, too?
NO… BECAUSE OF THE EXTENSIONS. THEY MESS THINGS UP TOTALLY. HOPEFULLY YOU WILL SEE THAT FROM THE ABOVE CHART. YOU WILL ALSO SEE IT IN THE VIDEO OF THE WAVE CLUSTERS FOR WAVE (iii) and WAVE (v)’s.

Lately I have dug deep into wave relationships. I found the work of Swannel quiet enlightening (see attached).

When I see your work and your levels, the levels I have found myself, the traditional levels, the work of Swannel, one comes to the conclusion, that it all boils down to the assumption, that it is not possible to forcast the exact end of a move. There are simply too many levels involved which are high probability retracement levels(zones).
THERE ARE MANY POTENTIAL PROJECTIONS. IF YOU ARE ONLY LOOKING AT THE CURRENT WAVE DEGREE IT WOULD BE TOUGH. HOWEVER, IF YOU HAVE TO FIT THE NEXT MOVE INTO THE LARGER WAVE DEGREE (AND POSSIBLY EVEN THE WAVE DEGREE HIGHER THAN THAT) YOU WILL BEGIN TO FIND THAT IT’S NOT AS DIFFICULT AS YOU THINK. THE EXAMPLE OF THE DOW – MY FORECAST FOR 12,600 +/- 200 POINTS FOLLOWED BY A 20% PRICE DROP WAS MADE BY A COMBINATION OF UNDERSTANDING THAT THE FINAL WAVE ((A)) WILL FALL SOMEWHERE AROUND 14K. KNOWING THAT WE’D GET BETWEEN 50%&58.6% RETRACEMENT IN WAVE (iv) I KNEW APPROXIMATELY WHERE WAVE (iii) WOULD NEED TO FALL. THEN I IDENTIFIED THE LIKELY POINTS IN THE SPREADSHEET.

But which of all this levels to chose, day in day out, with a high grade of reproducibility and confidence, that is beyond of my imagination.

When I remember correctly, fibs did not play a big rule in the beginning of Elliott works. It was baked in later.
ELLIOTT ALWAYS SAID THAT THERE WERE NATURAL RELATIONSHIPS IN THE MARKETS… THAT HE DIDN’T DISCOVER THEM IS UNDERSTANDABLE. WE HAVE SPREADSHEETS… HE HAD A PAPER AND PENCIL… SEE THE VIDEO ON PROJECTION CLUSTERS AND YOU’LL CHANGE YOUR MIND!

When I started with Elliot wave years ago, I thought it was a tradeable system in itself. But in leveraged trading that simply does not work. I can say: I failed miserably. When I got early into an impulsive move I felt like the king of traders, but often enough my gains melted away in corrections or complex corrections.

I was only able to make a profitable system in combining EW with other methods.
ELLIOTT WAVE – R.N’S OR MY VERSION ARE NOT TRADING SYSTEMS. THEY ARE PRICE INDICATORS AND LIKE ANY SENSIBLE APPROACH, THAT YOU HAVE CLEARLY SAID, IS TO COMBINE COMPLEMENTARY INFORMATION FROM DIFFERENT INDICATORS, MOMENTUM, TIME AND WHILE I DON’T USE FUNDAMENTALS AS IT WOULD SKEW THE PRICE INDICATOR, IT IS A VALID TOOL. (SEE MY FIRST BOOK, INTEGRATED T.A.)

Well, we can clearly see 5-wave moves in the market. But when we assume in HEW, that all the moves are fractal, and we are speaking generally of ABC corrective moves, then shouldn't we be on the way to claim,
FUNNILY ENOUGH, I HAD PROBLEMS SWITCHING AT FIRST, MANY OTHERS HAVE SAID THE SAME THING. NOW I CANNOT SEE R.N.’S COUNT ANY MORE…

that HEW works with only 3-wave moves? In this case we would have to label a toping wave 5 as kind of B-wave of an ABC-flat.

Doing it in this way would lead again to a fractal nature of HEW, which out of my sight the actual HEW not is (due to the discrepancy in 5-waves moves and 3 wave moves).
THERE IS NO DISCREPANCY BETWEEN 5 & 3 WAVES AS DESCRIBED ABOVE…

Ian, many thanks for your Excel table. I found it a few days ago. Great tool :-)
YOU’RE WELCOME… ☺

Jan, one last question:

the retracement and expansion levels you use: have you obtained them via your observations, or are the obtained via statistical program? All I know right now is: they work very well
I KNEW FOR SOME WHILE BEFORE I WROTE THE BOOK THAT THE WAVE RELATIONSHIPS WERE WITHIN THE 3-WAVE GROUPS BUT IT WAS ONLY WHEN I SAT DOWN TO PROVE THAT IT COULDN’T BE DONE IN THE TRADITIONAL VERSION THAT IT ALL CLICKED. THE RATIOS I HAVE FOUND ARE VALID FROM THE 1m MARKET TO MONTHLY MARKET… SO ALL DONE BY OBSERVATION…


Ian
No I haven't got the wave structure wrong! I've corrected it!
 
 
  • Post #5,496
  • Quote
  • Nov 25, 2012 6:23pm Nov 25, 2012 6:23pm
  •  infinitus
  • Joined Jun 2010 | Status: s = k log W | 20,603 Posts
Hi Jan,

thank you very much for answering extensively. Let me write in red :-)


Markus

Thanks for the questions. I have provided some responses. I've placed my responses in capitals (no I'm not shouting!) and in blue to make it easier to see them.

The waves are fractal. When I have an 1-2-3-4-5 impulse in traditional EW, than the fractal nature is easy to understand. 1-3-5 do consist out of 1-2-3-4-5 again. And so on.

But what about Harmonic EW? OK, we have an 1-2-3-4-5 impulse, too. But each of the actionary waves 1-3-5 consists of an A-B-C move.
CORRECT

When we start to think this further, we would get a strange fractal behavior, kind of alternating fractal. What do I mean:
let us look at the first impulse 1-2-3-4-5 (why is here a 5 wave and not an ABC)
5-WAVES WILL ONLY EVER CREATE WAVE A OR WAVE C

now zoom into wave 1: we get A-B-C (where is the 5 wave structure) (only in substructures)
now zoom into wave A: we get A-B-C (where is the 5 wave structure) (only in substructure)
I THINK THERE WAS A MISUNDERSTANDING IN WHAT I SUGGESTED WAS WAVE (i) SEE THIS CHART:

http://i1079.photobucket.com/albums/...SDfractals.png

But that contradicts.
HOPEFULLY YOU SEE NOW THERE IS NO CONTRADICATION

Well, no, I understood the charts in your book well :-) See, sometimes I am trading on tick charts, even there in the smallest of strucktures you can observe EW pattern. This fractal pattern are set forth to higher TF's and so on. Ahh, I do not know how to put it into words LOL

It is hard for me to think in ABC when at the same time there a everywhere 5 wave moves. Maybe I just need some time to digest it and simply start to work with it. Maybe I should not so much worry about fractal nature. We will see....

Maybe I am too confused right now with fractal behavior. But it all boils down to the question: at what wave degree there can be a 5 wave impulse and where not?
I SHOULD POINT OUT THAT SO FAR YOU HAVE MADE NO MENTION OF IDENTIFYING WAVES THROUGH RATIOS. YOU CAN SEE FROM THE CHART ABOVE THAT DEEP WAVE B’S CAN MAKE WAVES LOOK DIFFERENT TO WHAT THEY ARE. IT IS VITAL THAT MEASUREMENTS ARE MADE…

Yes, I understand that


When we assume the system to be fractal, then each actionary wave should also be 5 wave (or we build a fractal system with only 3-wave moves). In no logical way we can assume a 5 wave move but the fractals of it to be only 3 wave moves.
WHY IS THAT? THINK OF THE DOW THEORY…
SEE THE FOLLOWING VIDEOS ON HEW THAT PROVIDES INFO ON FRACTALS – AND ALTERNATION. I SUGGEST YOU LOOK AT THE INTRO VIDEO AT THE TOP LEFT OF MY BLOG THAT DESCRIBES HOW I FEEL ELLIOTT MAY HAVE INTRODUCED EXTENSIONS BY MISTAKE. WE ARE ALL COUNTING 5-WAVE MOVES. I AM JUST RE-ORGANISING THEM INTO DIFFERENT 3-WAVE GROUPINGS AND YOU’LL SEE HOW CONSISTENT THE PROJECTIONS ARE ACROSS ALL WAVE DEGREES

http://harmonicelliottwave.blogspot....h/label/Videos

Will watch it again and again :-)


The core question:

with what logic and on what timeframe we are looking for 5 wave moves?
THERE IS NO TIME FRAME TO WAVES… THEY CAN BE TERRIBLY SLOW, THEY CAN DEVELOP EXCEPTIONALLY QUICKLY

For me, different TF's are like observing the fractal waves through a microscope. Maybe I have to rethink my understanding of fractals? Do not know...

With HEW we are forced to look at a specific time for a 5- wave move, don't we?
WE ARE NOT…

Well, we certainly may deny the fractal behavior of waves, but then we must be able to define the TF where the structure is 5 wave and where ABC
I HAVE COVERED THIS ABOVE

But when I read the intro of your web page correctly you too belief in the fractal nature.


Maybe it is hard to understand what I mean. I hope you do :-)


Second question:

You wrote, that the traditional Elliott waves seldomly reach the ideal fib-relations/targets. That is true from my experience too.

But when I look now at your extensions, there are only few fib numbers involved, too. Would it not be possible to gain similar results with "modified" fib-levels in traditional Elliott wave, too?
NO… BECAUSE OF THE EXTENSIONS. THEY MESS THINGS UP TOTALLY. HOPEFULLY YOU WILL SEE THAT FROM THE ABOVE CHART. YOU WILL ALSO SEE IT IN THE VIDEO OF THE WAVE CLUSTERS FOR WAVE (iii) and WAVE (v)’s.

Lately I have dug deep into wave relationships. I found the work of Swannel quiet enlightening (see attached).

When I see your work and your levels, the levels I have found myself, the traditional levels, the work of Swannel, one comes to the conclusion, that it all boils down to the assumption, that it is not possible to forcast the exact end of a move. There are simply too many levels involved which are high probability retracement levels(zones).
THERE ARE MANY POTENTIAL PROJECTIONS. IF YOU ARE ONLY LOOKING AT THE CURRENT WAVE DEGREE IT WOULD BE TOUGH. HOWEVER, IF YOU HAVE TO FIT THE NEXT MOVE INTO THE LARGER WAVE DEGREE (AND POSSIBLY EVEN THE WAVE DEGREE HIGHER THAN THAT) YOU WILL BEGIN TO FIND THAT IT’S NOT AS DIFFICULT AS YOU THINK. THE EXAMPLE OF THE DOW – MY FORECAST FOR 12,600 +/- 200 POINTS FOLLOWED BY A 20% PRICE DROP WAS MADE BY A COMBINATION OF UNDERSTANDING THAT THE FINAL WAVE ((A)) WILL FALL SOMEWHERE AROUND 14K. KNOWING THAT WE’D GET BETWEEN 50%&58.6% RETRACEMENT IN WAVE (iv) I KNEW APPROXIMATELY WHERE WAVE (iii) WOULD NEED TO FALL. THEN I IDENTIFIED THE LIKELY POINTS IN THE SPREADSHEET.

I constantly count on different TF's up to monthly to see, if my lower degree counts fit in the larger degrees and vice versa. So I am used to overlay extensions/projections and retracements of the various wave degrees. But often enough I am left in numerous possible levels. Well, maybe it gets mor clear with HEW, but the number of possible levels in HEW is quite big


But which of all this levels to chose, day in day out, with a high grade of reproducibility and confidence, that is beyond of my imagination.

When I remember correctly, fibs did not play a big rule in the beginning of Elliott works. It was baked in later.
ELLIOTT ALWAYS SAID THAT THERE WERE NATURAL RELATIONSHIPS IN THE MARKETS… THAT HE DIDN’T DISCOVER THEM IS UNDERSTANDABLE. WE HAVE SPREADSHEETS… HE HAD A PAPER AND PENCIL… SEE THE VIDEO ON PROJECTION CLUSTERS AND YOU’LL CHANGE YOUR MIND!

When I started with Elliot wave years ago, I thought it was a tradeable system in itself. But in leveraged trading that simply does not work. I can say: I failed miserably. When I got early into an impulsive move I felt like the king of traders, but often enough my gains melted away in corrections or complex corrections.

I was only able to make a profitable system in combining EW with other methods.
ELLIOTT WAVE – R.N’S OR MY VERSION ARE NOT TRADING SYSTEMS. THEY ARE PRICE INDICATORS AND LIKE ANY SENSIBLE APPROACH, THAT YOU HAVE CLEARLY SAID, IS TO COMBINE COMPLEMENTARY INFORMATION FROM DIFFERENT INDICATORS, MOMENTUM, TIME AND WHILE I DON’T USE FUNDAMENTALS AS IT WOULD SKEW THE PRICE INDICATOR, IT IS A VALID TOOL. (SEE MY FIRST BOOK, INTEGRATED T.A.)

Well, we can clearly see 5-wave moves in the market. But when we assume in HEW, that all the moves are fractal, and we are speaking generally of ABC corrective moves, then shouldn't we be on the way to claim,
FUNNILY ENOUGH, I HAD PROBLEMS SWITCHING AT FIRST, MANY OTHERS HAVE SAID THE SAME THING. NOW I CANNOT SEE R.N.’S COUNT ANY MORE…

that HEW works with only 3-wave moves? In this case we would have to label a toping wave 5 as kind of B-wave of an ABC-flat.

Doing it in this way would lead again to a fractal nature of HEW, which out of my sight the actual HEW not is (due to the discrepancy in 5-waves moves and 3 wave moves).
THERE IS NO DISCREPANCY BETWEEN 5 & 3 WAVES AS DESCRIBED ABOVE…

Ian, many thanks for your Excel table. I found it a few days ago. Great tool :-)
YOU’RE WELCOME… ☺

Jan, one last question:

the retracement and expansion levels you use: have you obtained them via your observations, or are the obtained via statistical program? All I know right now is: they work very well
I KNEW FOR SOME WHILE BEFORE I WROTE THE BOOK THAT THE WAVE RELATIONSHIPS WERE WITHIN THE 3-WAVE GROUPS BUT IT WAS ONLY WHEN I SAT DOWN TO PROVE THAT IT COULDN’T BE DONE IN THE TRADITIONAL VERSION THAT IT ALL CLICKED. THE RATIOS I HAVE FOUND ARE VALID FROM THE 1m MARKET TO MONTHLY MARKET… SO ALL DONE BY OBSERVATION…


Ian


Again, Ian, many thanks for sharing your expertise :-)


Markus
 
 
  • Post #5,497
  • Quote
  • Nov 25, 2012 9:25pm Nov 25, 2012 9:25pm
  •  Ian Copsey
  • | Commercial Member | Joined Nov 2010 | 447 Posts
Quoting infinitus
Disliked
Hi Jan,

thank you very much for answering extensively. Let me write in red :-)


Markus

Thanks for the questions. I have provided some responses. I've placed my responses in capitals (no I'm not shouting!) and in blue to make it easier to see them.

The waves are fractal. When I have an 1-2-3-4-5 impulse in traditional EW, than the fractal nature is easy to understand. 1-3-5 do consist out of 1-2-3-4-5 again. And so on.

But what about Harmonic EW? OK, we have an 1-2-3-4-5 impulse, too. But...
Ignored
Hi Markus

Yes, I do understand it's difficult to switch perception after using EW for so long. If you are interested (and obviously I recommend it as it is far more logical) you could start using the spreadsheet to identify waves. Keep an eye out on my occasional weekly updates that have projections drawn. (Look at the USDJPY weekly outlook in early October that has been almost perfect so far.)

Do keep in mind alternation that in HEW is not just simple versus complex but also depth. Wave (ii) and Wave (iv) have relationships. The video on alternation in the S&P will highlight that extremely well. Also note the Wave -b- of Wave -iii- in the rally from July 2010 - it's extremely shallow but was correct as it provided the opportunity to forecast the next 4 turning points up to 2 months in advance.

As I mentioned, the range of projections becomes very much narrower once you understand the relationships within the larger wave degree. On occasions I've already identified the high risk area even before Wave (i) is complete because I know that the final target is the prior Wave (b)...

Good luck!
Ian
No I haven't got the wave structure wrong! I've corrected it!
 
 
  • Post #5,498
  • Quote
  • Nov 26, 2012 8:01am Nov 26, 2012 8:01am
  •  infinitus
  • Joined Jun 2010 | Status: s = k log W | 20,603 Posts
Quoting infinitus
Disliked
Trading conclusion:


best place to short was around 2985-2990 with risk at 3021.

Chance is ideally 2955 to 2940. When you short right here, R:R is bad, because of around 50pips risk and 25-50 pips return.


Conclusion:

short with SL right above the recent top, with TP 2960, 2945 and rest at will (with SL at BE)

if stopped out, watch 3020 to eventually reshort again with SL behind 3070.


Set money management accordingly.
Ignored


so far, so good

as expected correction seems to get sideways rather much down


2943 is protecting so far. If broken watch out for support shelf around 2910 and 2898
 
 
  • Post #5,499
  • Quote
  • Nov 26, 2012 8:27am Nov 26, 2012 8:27am
  •  infinitus
  • Joined Jun 2010 | Status: s = k log W | 20,603 Posts
Quoting infinitus
Disliked
so far, so good

as expected correction seems to get sideways rather much down


2943 is protecting so far. If broken watch out for support shelf around 2910 and 2898
Ignored
Hmm, as my main count was, that the upwards move was likely finished, I have to change my count a bit to alow for at least one more wave higher.


Next logical target to the upper side is 3020. After that I expect again test of around 2940. After that, when the 2940 area hold firm, extensions down to around 2900 allowed, we may see final move towards max 3160, extension even towards 3225


Will later on do more precise calculations

from a Murrey Math point of view 306s is important. Break of this would offer 3184 and 3306. This levels then will offer more bullish potential after an adequate retrace
 
 
  • Post #5,500
  • Quote
  • Nov 26, 2012 7:44pm Nov 26, 2012 7:44pm
  •  infinitus
  • Joined Jun 2010 | Status: s = k log W | 20,603 Posts
Quoting infinitus
Disliked
Hmm, as my main count was, that the upwards move was likely finished, I have to change my count a bit to alow for at least one more wave higher.


Next logical target to the upper side is 3020. After that I expect again test of around 2940. After that, when the 2940 area hold firm, extensions down to around 2900 allowed, we may see final move towards max 3160, extension even towards 3225


Will later on do more precise calculations

from a Murrey Math point of view 306s is important. Break of this would offer 3184 and 3306. This levels...
Ignored
right now have two estimations:


bearish case: 3022 to 3069 (ideally 3056)


bullish case: 3149 to 3227
 
 
  • Interactive Trading
  • /
  • Elliott Wave Trading
  • Reply to Thread
    • 1 273274Page 275276277 457
    • 1 Page 275 457
6 traders viewing now
  • More
Top of Page
  • Facebook
  • Twitter
About FF
  • Mission
  • Products
  • User Guide
  • Media Kit
  • Blog
  • Contact
FF Products
  • Forums
  • Trades
  • Calendar
  • News
  • Market
  • Brokers
  • Trade Explorer
FF Website
  • Homepage
  • Search
  • Members
  • Report a Bug
Follow FF
  • Facebook
  • Twitter

FF Sister Sites:

  • Metals Mine
  • Energy EXCH
  • Crypto Craft

Forex Factory® is a brand of Fair Economy, Inc.

Terms of Service / ©2023