In the TMA thread: https://www.forexfactory.com/showthread.php?t=922947
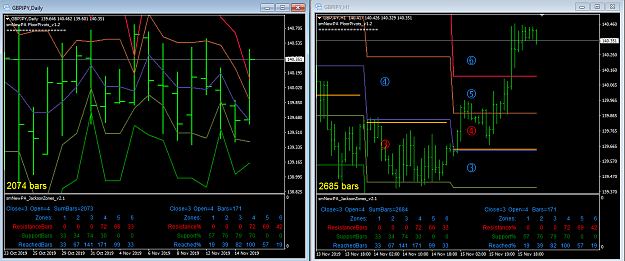
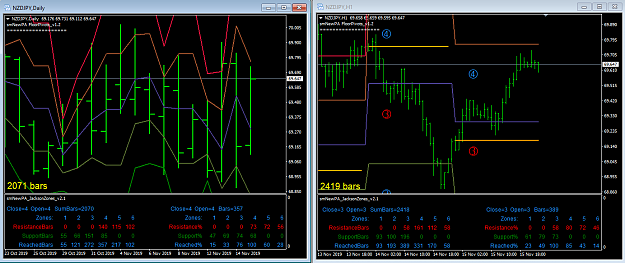
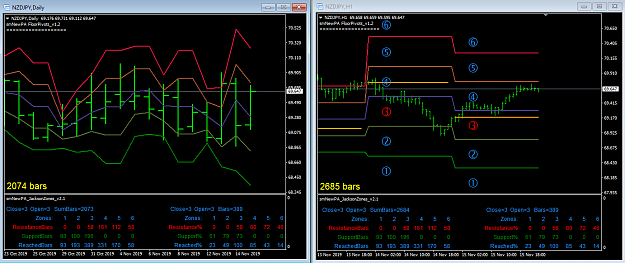
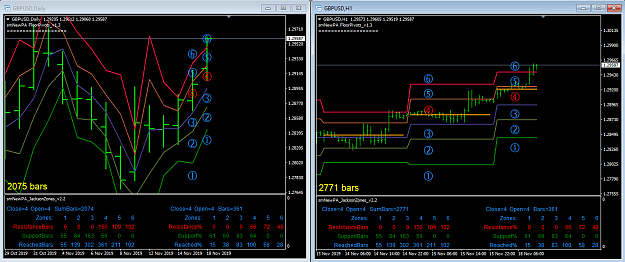
by chance I mentioned the "Jackson Zones" and posted some indicators that I programmed about ten years ago.
Later I will write more in this #Post 1.
Please the users who have interest for JZ to post here comments or current trades.
Please do not ask questions about JZ, and first read the documentation on the internet.
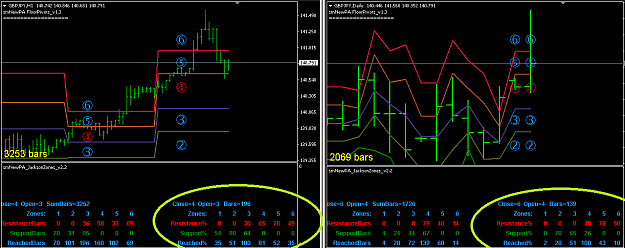
(I think I have to check the formulas so that the Arrows match the lines, or vice versa ...!)
The "Pivots" indicator (Arrows) needs to be developed further.
by chance I mentioned the "Jackson Zones" and posted some indicators that I programmed about ten years ago.
QuoteDislikedHere have you the informations: http://www.fibonaccitrader.com/
More information on High Probability Fibonacci Zones
http://www.fibonaccitrader.com/HELP4...acci_zones.htm
and how to use these zones is explained on the Fibonacci Trader Journal # 14
http://www.fibonaccitrader.com/journals/FTJ14.pdf
Later I will write more in this #Post 1.
Please the users who have interest for JZ to post here comments or current trades.
Please do not ask questions about JZ, and first read the documentation on the internet.
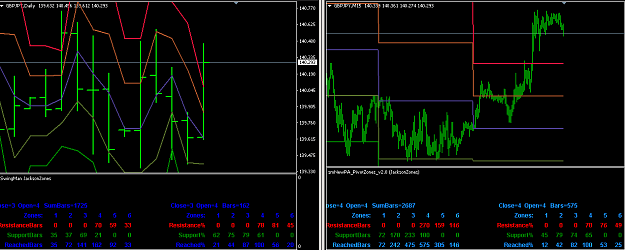
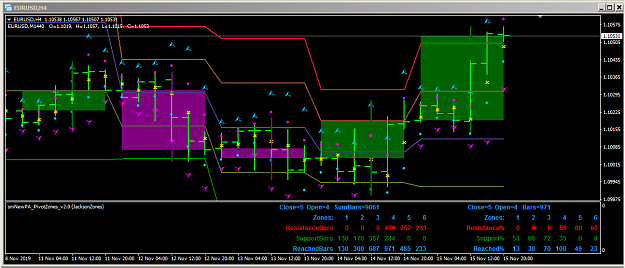
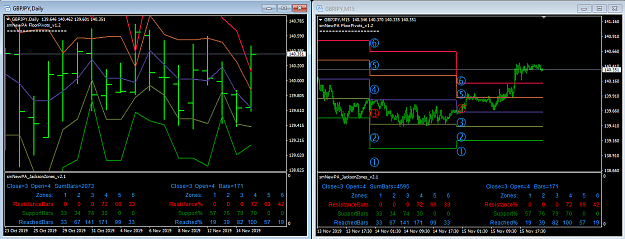
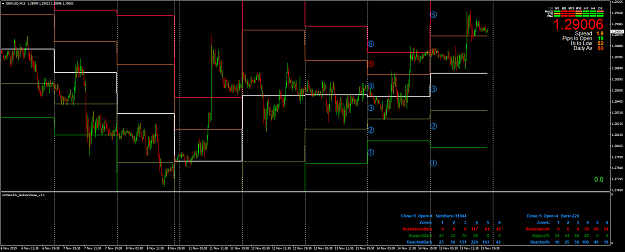
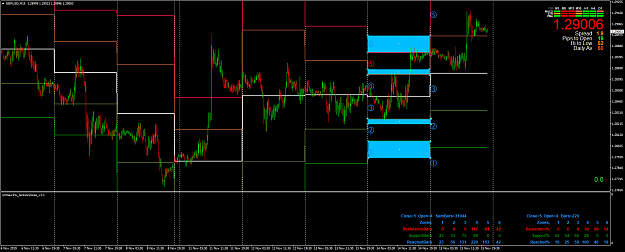
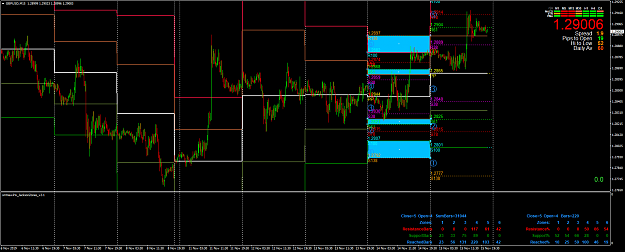
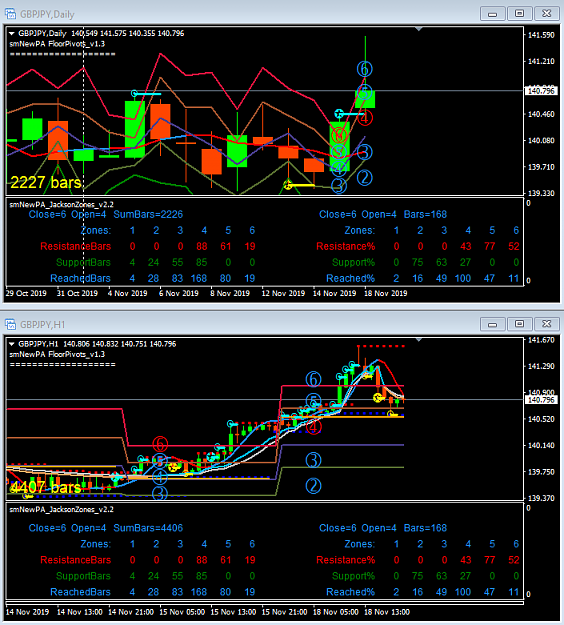
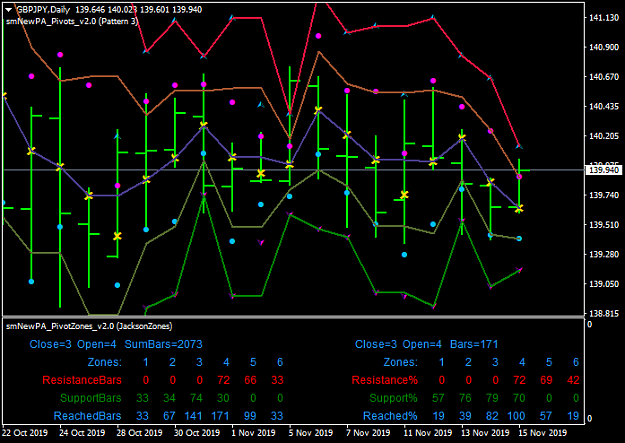
Attached Image (click to enlarge)
(I think I have to check the formulas so that the Arrows match the lines, or vice versa ...!)
The "Pivots" indicator (Arrows) needs to be developed further.
Attached File(s)