QUESTIONS ABOUT TIMEFRAME AND PAIR WILL TAKE YOU TO MY IGNORE LIST!!!
Before i will start, i will make clear that i am not tollerate mad behavior.
Do not post unsuitable informations, pictures, videos, links and so on.
Respect eachother, respect that this thread is for the real new ones, or for those who want to restart, the really early days and must not become a showcase of your indicator list.
Here we will not give a secret trading system, here will never find a complete system.
If you go against my rules, you will find you on my ignore list very fast.
Some words about my motivation building this thread:
I do this, because i miss the point in my starting days and wish i have had such a place. I am not aware about how important this step watching the chart naked is!
Many misleading/false informations are around, not only here.
Motivate newcomer to build the own view on the chart, because it give not "the only way".
Reduce the fear making something wrong, that is in the first stage present.
Knowing the traps! If you new to trading you will so easy flood with unsuitable and often false informations. Myths are all around and will easy destroy your way to learn, sometimes it will cost you several years. Be careful! Only what YOU able to see, will YOU later trade.
How to avoid a false start, here we go ...
- ignore all systems first
- do not put indicators in your chart, not one
- never think about robots, never
- do not give your attention to multi timeframe analysis that early
- do not take for real that you must trade without emotions, you are human, you breath, you have all the emotions avaible
- do not think about you must have higher hit rate to be have in long run profit, no need to have 50% and more, it is statistic, as you put your hand on a cold and on a hot hotplate, would you have lukewarm hands?
- do not take candle patterns in your tool box, no need for it
- zoom to strong in chart without have a clue how the chart is unzoomed
What will help you to start, here some points ...
- prepare a place that you can concentrate in calm, no hectic, no influence that must you over and over again break from training
- pick eye friendly colors, not too many, not too different, invest in good monitor if you able to do this, make enough breaks
- pick ONE pair, metal or whatever (majors are prefered) and one timeframe you are able to trade, not your life must fit your timeframe, the timeframe must select after the time you can invest for trading
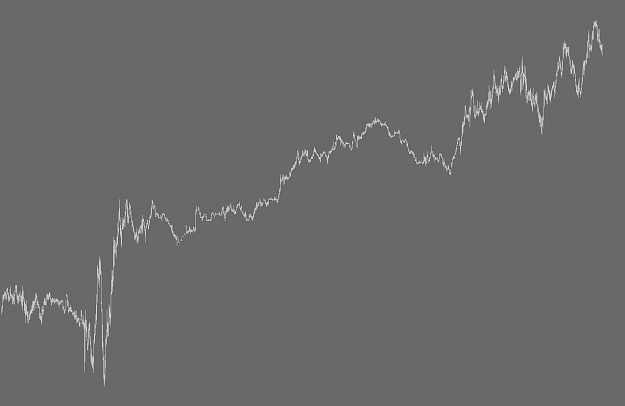
- zoom this chart complete out, so you can not see a single candle
- take pencil and paper and watch the same chart over and over again, note what you see, what is price making. Are things visible you see more often? Is a connection in any form? Do not underestimate how important this is you do it like your grandparents done in the past!
- bring your results in a form, can you sort some things you have over and over explored?
Some points that often new trader want to improve, that come in the next steps (first learn read the chart as it is). Do not take care about yet ...
- Think about percentage growing in a day/week/month
- Risk for one trade, 1% or more/less
- Reward for one trade
Read the chart as it is - Training
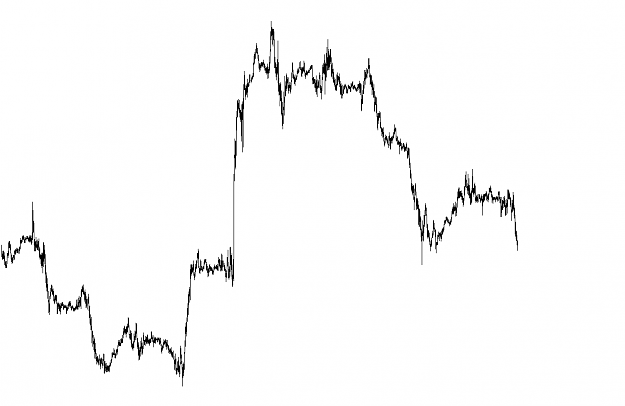
I will in future upload single charts without timeframe, without price ruler on the right and time on the bottom.
New trader can jump in, pick the picture and draw, explain what can he see.
You do good if you print it out and do manual if you really new to trading, because you will learn that way more deeper. It is not a must and can be done with software also.
If we have minimum one rookie picture i search for a senior member to show us another view.
... now here will some great posts take place agin in the first post.
from jmflukeiii in post 140
"Michaels response hit the nail on the head; just watch the chart without the pressure of making a decision (meaning don’t try to trade, just watch). Mark a place where price seemed to turn; see what happens when it gets back there: does it break, and by how much, and with what force, and what happens after that? Does it hold, and if so, how much did the line break before it held, and how quickly did it reverse? My first mentor said you need nothing more than the price and manually drawn lines; it took a long time to figure out, but he was right. Where to draw the lines is the question, and what to do with the price around those lines is the next."
from jmflukeii in post 144
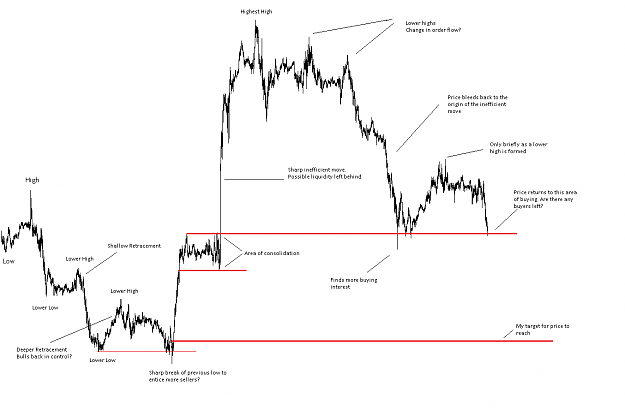
"Well, I suspect there are all sorts of ways people make trading decisions including in depth statistical analysis. The bottom line is markets are an auction; price moves up until there are no more buyers (or there is more aggressive selling than buying) and moves down until there are no more sellers (or more aggressive buying than selling). RSI, Stochastics, MACD, all that has nothing to do with what is happening. They can perhaps be used to create a consistent set of entry and exit conditions, but as you are a 'data guy', wouldn't you rather try to "see" as best you can what is actually happening?
What is actually happening is price moves up to a certain price and either (a) there are no more buyers or (b) there are more aggressive sellers than buyers. This creates a swing point. What happens the next time you get back there? Will aggressive sellers defend their position (its an analogy, its more likely institutional orders that have a VWAP target for their fills), or will Sellers have now been exhausted (i.e. disappeared) and Buyers are back in control. As a 'data guy', you can define what constitutes a relevant swing point (i.e. depth of pullback from prior swing points, duration of existence before touched again), mark those points, and then gather statistics about what happens when price returns. Does it (a) bounce off and if so, what was the overriding trend at the time (left side of monitor is higher or lower or equal to right side) or (b) does it break and what happens next? How much of a break constitutes a "break" vs. a "failed break".
I don't believe this business is a black and white business, there is lots of gray area. Everything looks somewhat similar to something before, but never exactly the same.
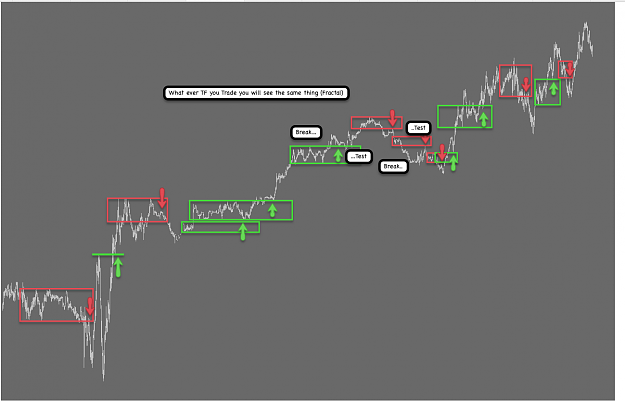
Last think I'll say is that I think there are only 3 types of entries: pullbacks, breakouts, and failed breakouts. To use them, you need to understand (a) what is breaking or failing to break and (b) what is the main trend that is currently "pulling back". If you can figure out (a), then you will know what (b) is. I'm not trying to be cryptic, and hope it doesn't come off as that, but its for everyone themselves to decide I think. I have posted in this thread about how I define "trend" and how I find the points that break to change that trend."
Before i will start, i will make clear that i am not tollerate mad behavior.
Do not post unsuitable informations, pictures, videos, links and so on.
Respect eachother, respect that this thread is for the real new ones, or for those who want to restart, the really early days and must not become a showcase of your indicator list.
Here we will not give a secret trading system, here will never find a complete system.
If you go against my rules, you will find you on my ignore list very fast.
Some words about my motivation building this thread:
I do this, because i miss the point in my starting days and wish i have had such a place. I am not aware about how important this step watching the chart naked is!
Many misleading/false informations are around, not only here.
Motivate newcomer to build the own view on the chart, because it give not "the only way".
Reduce the fear making something wrong, that is in the first stage present.
Knowing the traps! If you new to trading you will so easy flood with unsuitable and often false informations. Myths are all around and will easy destroy your way to learn, sometimes it will cost you several years. Be careful! Only what YOU able to see, will YOU later trade.
How to avoid a false start, here we go ...
- ignore all systems first
- do not put indicators in your chart, not one
- never think about robots, never
- do not give your attention to multi timeframe analysis that early
- do not take for real that you must trade without emotions, you are human, you breath, you have all the emotions avaible
- do not think about you must have higher hit rate to be have in long run profit, no need to have 50% and more, it is statistic, as you put your hand on a cold and on a hot hotplate, would you have lukewarm hands?
- do not take candle patterns in your tool box, no need for it
- zoom to strong in chart without have a clue how the chart is unzoomed
What will help you to start, here some points ...
- prepare a place that you can concentrate in calm, no hectic, no influence that must you over and over again break from training
- pick eye friendly colors, not too many, not too different, invest in good monitor if you able to do this, make enough breaks
- pick ONE pair, metal or whatever (majors are prefered) and one timeframe you are able to trade, not your life must fit your timeframe, the timeframe must select after the time you can invest for trading
- zoom this chart complete out, so you can not see a single candle
- take pencil and paper and watch the same chart over and over again, note what you see, what is price making. Are things visible you see more often? Is a connection in any form? Do not underestimate how important this is you do it like your grandparents done in the past!
- bring your results in a form, can you sort some things you have over and over explored?
Some points that often new trader want to improve, that come in the next steps (first learn read the chart as it is). Do not take care about yet ...
- Think about percentage growing in a day/week/month
- Risk for one trade, 1% or more/less
- Reward for one trade
Read the chart as it is - Training
I will in future upload single charts without timeframe, without price ruler on the right and time on the bottom.
New trader can jump in, pick the picture and draw, explain what can he see.
You do good if you print it out and do manual if you really new to trading, because you will learn that way more deeper. It is not a must and can be done with software also.
If we have minimum one rookie picture i search for a senior member to show us another view.
... now here will some great posts take place agin in the first post.
from jmflukeiii in post 140
"Michaels response hit the nail on the head; just watch the chart without the pressure of making a decision (meaning don’t try to trade, just watch). Mark a place where price seemed to turn; see what happens when it gets back there: does it break, and by how much, and with what force, and what happens after that? Does it hold, and if so, how much did the line break before it held, and how quickly did it reverse? My first mentor said you need nothing more than the price and manually drawn lines; it took a long time to figure out, but he was right. Where to draw the lines is the question, and what to do with the price around those lines is the next."
from jmflukeii in post 144
"Well, I suspect there are all sorts of ways people make trading decisions including in depth statistical analysis. The bottom line is markets are an auction; price moves up until there are no more buyers (or there is more aggressive selling than buying) and moves down until there are no more sellers (or more aggressive buying than selling). RSI, Stochastics, MACD, all that has nothing to do with what is happening. They can perhaps be used to create a consistent set of entry and exit conditions, but as you are a 'data guy', wouldn't you rather try to "see" as best you can what is actually happening?
What is actually happening is price moves up to a certain price and either (a) there are no more buyers or (b) there are more aggressive sellers than buyers. This creates a swing point. What happens the next time you get back there? Will aggressive sellers defend their position (its an analogy, its more likely institutional orders that have a VWAP target for their fills), or will Sellers have now been exhausted (i.e. disappeared) and Buyers are back in control. As a 'data guy', you can define what constitutes a relevant swing point (i.e. depth of pullback from prior swing points, duration of existence before touched again), mark those points, and then gather statistics about what happens when price returns. Does it (a) bounce off and if so, what was the overriding trend at the time (left side of monitor is higher or lower or equal to right side) or (b) does it break and what happens next? How much of a break constitutes a "break" vs. a "failed break".
I don't believe this business is a black and white business, there is lots of gray area. Everything looks somewhat similar to something before, but never exactly the same.
Last think I'll say is that I think there are only 3 types of entries: pullbacks, breakouts, and failed breakouts. To use them, you need to understand (a) what is breaking or failing to break and (b) what is the main trend that is currently "pulling back". If you can figure out (a), then you will know what (b) is. I'm not trying to be cryptic, and hope it doesn't come off as that, but its for everyone themselves to decide I think. I have posted in this thread about how I define "trend" and how I find the points that break to change that trend."
Market is more simple as you think.