I want to understand what kind of data does my broker provide for Brent Crude Oil.
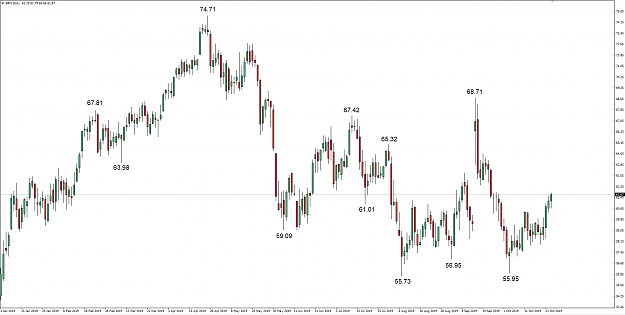
So this first chart is data provided by an fx broker. As I understand this, it is an unadjusted continuous chart for Brent Crude Oil futures?
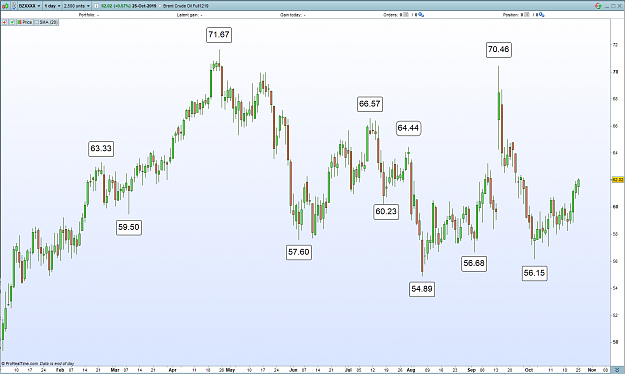
Second chart is taken from ProRealTime free end of data chart Brent Crude Oil Full1219:
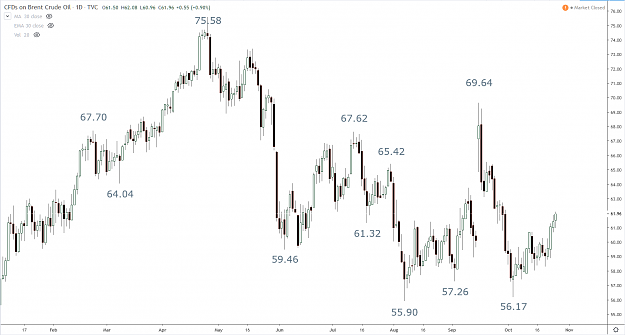
The third chart is taken from Trading View:
I have highlighted some highs and lows on each chart.
Please, can anybody explain, why there are such differences in these three charts that are technically charts for the same instrument?
Can you suggest any end of day free data for back-adjusted continuous futures chart for Brent Crude Oil?
Is the ProrealTime chart data above back-adjusted?
I don't need live data, just end of day data is enough.


