• Home
  • Forums
  • Trades
  • News
  • Calendar
  • Market
  • Brokers
  • Login
  • Join
  • User/Email: Password:
  • 1:07am
Menu
  • Forums
  • Trades
  • News
  • Calendar
  • Market
  • Brokers
  • Login
  • Join
  • 1:07am
Sister Sites
  • Metals Mine
  • Energy EXCH
  • Crypto Craft

Options

Bookmark Thread

First Page First Unread Last Page Last Post

Print Thread

Similar Threads

M candles / Custom candles for second charts 1 reply

Calculating only buy candles vs sell candles 2 replies

Platform which enables the rewinding of candles 3 replies

Missing candles? 1 reply

I need more candles! 4 replies

  • Trading Systems
  • /
  • Reply to Thread
  • Subscribe
  • 288
Attachments: Follow the Candles
Exit Attachments
Tags: Follow the Candles
Cancel

Follow the Candles

  • Last Post
  •  
  • Page 1 23456 59
  • Page 1 234 59
  •  
  • Post #1
  • Quote
  • First Post: Edited Jan 1, 2023 6:34pm Oct 19, 2019 12:05pm | Edited Jan 1, 2023 6:34pm
  •  mrdfx
  • Joined May 2017 | Status: Member | 3,686 Posts
Hey guys! So many traders are reversal traders, always looking for tops and bottoms trying get in as early as possible, but we know that is not as easy as it seems and many times we land up with fake reversals or temporary pullbacks, chasing and adding to losing positions etc, which only ends in losses..

Now I'm sure most of us have heard the sayings that the "trend is your friend", "follow the trend", and "trade with the trend", etc, so I gave this some serious thought and came up with an idea that I have been working on for a long time. I know that there are probably 1000's of trend based strategies and perhaps mine is not unique, but it has been showing positive results with minimal time and effort. I wanted to create a strategy that is easy to follow and with as less chart and screen time needed (max 10 mins) kind of like a set and forget approach.

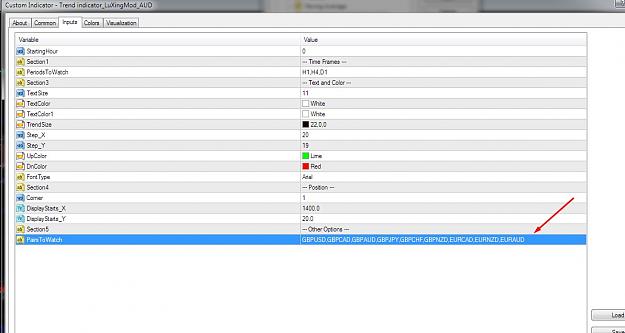
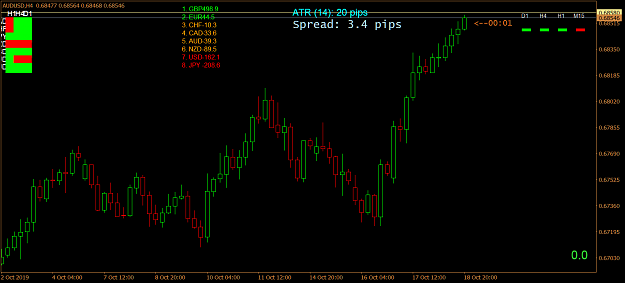
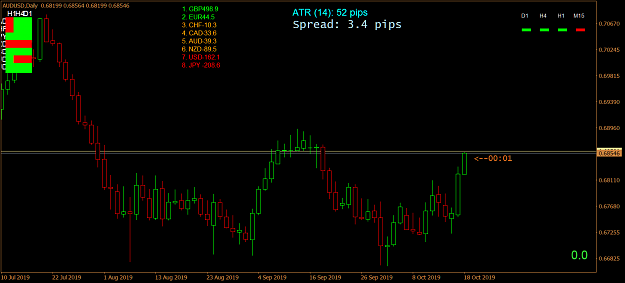
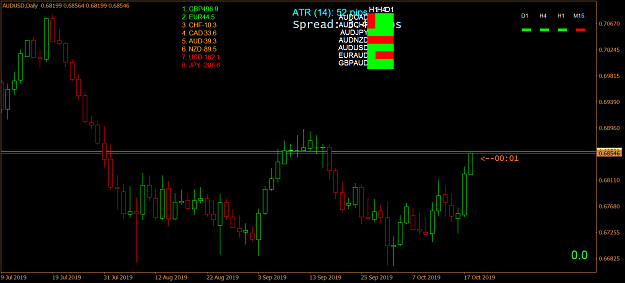
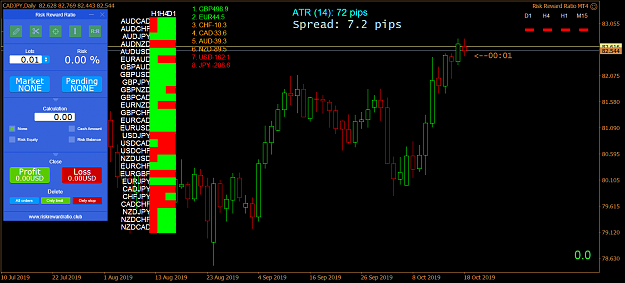
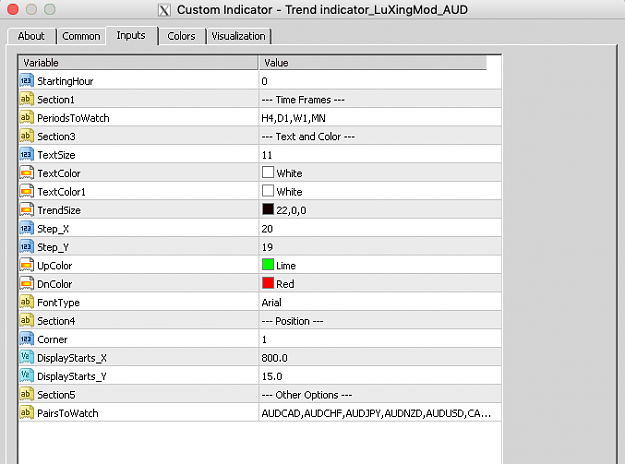
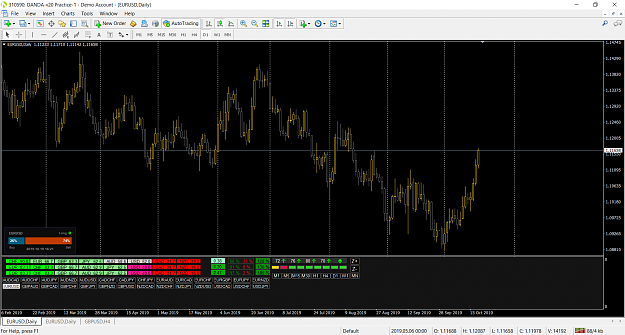
So here goes! The first thing you need is the Trend indicator LuXingMod AUD indicator, this is a free indicator I found here on FF (thanks to LuXing), it simply shows all the pairs candle direction for each time frame if it is green/up or red/down, simple. I've attached it to this thread.

Now what is the entry criteria and when do we open and close an order?

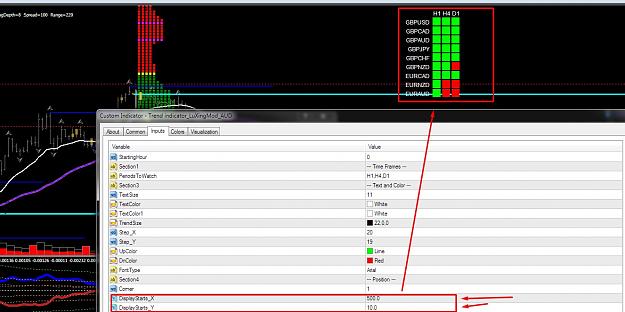
1. First we will edit the indicator settings to only show the H4, D1, W1, MN bars/candles as we are only looking at higher time frame trends.
2. When? On a Monday night 1 hour before the first daily candle of the week closes we will look for any pairs where is a confluence between the trend on all 4 time frames.
3. Any pairs that have the same confluence on all 4 time frames we will open an order in the same direction.
4. I normally wait for the first daily candle to be pretty much fully formed so more or less 1 hour before the Monday daily close.
5. When do we take profit? You take profit when you are happy with it or you can set your own TP in pips or %. I have set a 5% TP.
6. What about a stop loss? Well this is a personal preference, but I'm setting a max of 10% so if my account goes -10% of my account equity I'll close up for the week.
7. Can we set a trailing stop to trail profits? Sure that would be a good idea after reaching your TP.
8. This whole process should take you max 10 mins to look for valid pairs and place your orders.
9. Anything else? No that's it, simple right?

This is a really easy strategy guys, not much in it, we are simply following the overall main trend of the market. This is a weekly basket style approach where we will hold orders for 2-4 days depending on the market. This strategy does not take into account fundamentals or high impact news events so if you want to be extra cautious you can exclude any valid pairs that might be affected by related news events for the week.

I am also working on a new weekly setting that starts on a Tuesday morning and I am working on new daily sets that catch the daily trend and can be traded daily.

If you guys have some ideas on how to improve on the strategy I'm open to listening, however I will not encourage ideas that will completely deviate from the original strategy as its really simple and I don't want to complicate things.

I'm a fan of EA's and think they are great tools if used correctly so I had an EA made for me based on this strategy. The EA is pretty straight forward I think and should be easy enough to understand. The EA is also pretty customizable so you can also trade it on other sessions and time frames, you only need to configure the settings accordingly.

I have set the expiry date to 31/12/2023. This is protect it from being sold or commercialized etc.

*Due to some members comments I felt the need to state publicly that the Follow the Candles EA is FREE and always will be! The is no hidden commercial agenda or plans to sell the EA at any time.!*

Please guys let's stay on topic and try not to deviate too much from the original strategy. I will not tolerate any arguing or keyboard warriors, those that can't participate in a respectful friendly manner will be removed.

Green pips to you all! Cheers! :-)
Attached Image (click to enlarge)
Click to Enlarge

Name: Screenshot 2019-10-18 at 17.19.58.png
Size: 41 KB
Attached File(s)
File Type: ex4 Trend indicator_LuXingMod_AUD.ex4   24 KB | 4,763 downloads
File Type: mq4 Trend indicator_LuXingMod_AUD.mq4   14 KB | 5,441 downloads
File Type: ex4 Follow The Candles EA.ex4   218 KB | 95 downloads | Uploaded Jan 1, 2023 6:33pm
Truth is like poetry. And most people f*cking hate poetry.
  • Post #2
  • Quote
  • Oct 19, 2019 12:11pm Oct 19, 2019 12:11pm
  •  mrdfx
  • Joined May 2017 | Status: Member | 3,686 Posts
On Monday night after the first daily close candle of the week I'll post and share my valid pairs for the week.
Truth is like poetry. And most people f*cking hate poetry.
 
12
  • Post #3
  • Quote
  • Oct 19, 2019 1:12pm Oct 19, 2019 1:12pm
  •  tenthman
  • | Joined Mar 2009 | Status: Member | 181 Posts
The indicator doesn't load properly on my chart . The indi might work correctly for me if you showed the template you are using. Thanks.
 
 
  • Post #4
  • Quote
  • Oct 19, 2019 1:15pm Oct 19, 2019 1:15pm
  •  thisara1
  • | Commercial Member | Joined Sep 2018 | 1,409 Posts
Quoting tenthman
Disliked
The indicator doesn't load properly on my chart . The indi might work correctly for me if you showed the template you are using. Thanks.
Ignored
Manual added curruncy pair indicator input,,,
thank you share strategy mrdfx
Attached Image (click to enlarge)
Click to Enlarge

Name: Screenshot_2700.jpg
Size: 102 KB
 
1
  • Post #5
  • Quote
  • Oct 19, 2019 1:51pm Oct 19, 2019 1:51pm
  •  Go5
  • Joined Jun 2014 | Status: Invisible | 1,393 Posts
Quoting mrdfx
Disliked
On Monday night after the first daily close candle of the week I'll post and share my valid pairs for the week.
Ignored
Ok, so how do you calculate your lotsize?
 
1
  • Post #6
  • Quote
  • Oct 19, 2019 2:32pm Oct 19, 2019 2:32pm
  •  tenthman
  • | Joined Mar 2009 | Status: Member | 181 Posts
Quoting thisara1
Disliked
{quote} Manual added curruncy pair indicator input,,, thank you share strategy mrdfx {image}
Ignored

Nope ... not the problem. Something else. Here's the screen shot from the H4 and Day1 AUDUSD

I'd show you the settings for the indicator but I can't seem to be able to figure out how to do that. Thanks anyway.
Attached Image(s) (click to enlarge)
Click to Enlarge

Name: AUDUSDH4.png
Size: 48 KB
Click to Enlarge

Name: AUDUSDDaily.png
Size: 47 KB
 
 
  • Post #7
  • Quote
  • Oct 19, 2019 2:40pm Oct 19, 2019 2:40pm
  •  tenthman
  • | Joined Mar 2009 | Status: Member | 181 Posts
Quoting thisara1
Disliked
{quote} Manual added curruncy pair indicator input,,, thank you share strategy mrdfx {image}
Ignored
If the indi loads correctly on your chart, would you be so kind as to post your template?
 
 
  • Post #8
  • Quote
  • Oct 19, 2019 2:40pm Oct 19, 2019 2:40pm
  •  thisara1
  • | Commercial Member | Joined Sep 2018 | 1,409 Posts
Quoting tenthman
Disliked
{quote} Nope ... not the problem. Something else. Here's the screen shot from the H4 and Day1 AUDUSD I'd show you the settings for the indicator but I can't seem to be able to figure out how to do that. Thanks anyway. {image} {image}
Ignored

change here
Attached Image (click to enlarge)
Click to Enlarge

Name: Screenshot_2703.jpg
Size: 163 KB
 
 
  • Post #9
  • Quote
  • Oct 19, 2019 2:48pm Oct 19, 2019 2:48pm
  •  tenthman
  • | Joined Mar 2009 | Status: Member | 181 Posts
Quoting thisara1
Disliked
{quote} change here {image}
Ignored

Nope ... that just moves the rectangular gibberish to the right. If it works for you, just send the template.
Attached Image (click to enlarge)
Click to Enlarge

Name: AUDUSDDaily.png
Size: 51 KB
 
 
  • Post #10
  • Quote
  • Oct 19, 2019 2:51pm Oct 19, 2019 2:51pm
  •  tenthman
  • | Joined Mar 2009 | Status: Member | 181 Posts
Quoting tenthman
Disliked
{quote} Nope ... that just moves the rectangular gibberish to the right. If it works for you, just send the template. {image}
Ignored
Unless your saying I have to manually load all 28 pairs. It was pre-loaded with just the AUD pairs. I'll try that and let you know. Thanks.
 
 
  • Post #11
  • Quote
  • Oct 19, 2019 3:09pm Oct 19, 2019 3:09pm
  •  tenthman
  • | Joined Mar 2009 | Status: Member | 181 Posts
Quoting tenthman
Disliked
{quote} Unless your saying I have to manually load all 28 pairs. It was pre-loaded with just the AUD pairs. I'll try that and let you know. Thanks.
Ignored
Ok ... here's what it looks like now. Not the nicest, but I think I can work with it.
Attached Image (click to enlarge)
Click to Enlarge

Name: CADJPYDaily.png
Size: 82 KB
 
 
  • Post #12
  • Quote
  • Oct 19, 2019 3:23pm Oct 19, 2019 3:23pm
  •  MrGreen95
  • Joined Jan 2018 | Status: Member | 1,108 Posts
The problem in this system is that when the trend will start to change, it will takes time (and so stops losses) before it turns in a red/green dot on a monthly and weekly chart
 
 
  • Post #13
  • Quote
  • Oct 19, 2019 4:30pm Oct 19, 2019 4:30pm
  •  mrdfx
  • Joined May 2017 | Status: Member | 3,686 Posts
Quoting tenthman
Disliked
The indicator doesn't load properly on my chart . The indi might work correctly for me if you showed the template you are using. Thanks.
Ignored
Here are the settings I'm using. You need to play with the X and Y as it is dependent on your screen resolution.
Attached Image (click to enlarge)
Click to Enlarge

Name: Screenshot 2019-10-19 at 17.28.01.png
Size: 84 KB
Truth is like poetry. And most people f*cking hate poetry.
 
 
  • Post #14
  • Quote
  • Oct 19, 2019 4:33pm Oct 19, 2019 4:33pm
  •  mrdfx
  • Joined May 2017 | Status: Member | 3,686 Posts
Quoting Go5
Disliked
{quote} Ok, so how do you calculate your lotsize?
Ignored
Well lot size would depend on your account size and risk tolerance?

For testing over the last 3 months I have been using 0.01 only to count the profitability of profit in pips, but going forward I will probably use 1% risk per pair and increase the risk over time if it does well.
Truth is like poetry. And most people f*cking hate poetry.
 
 
  • Post #15
  • Quote
  • Oct 19, 2019 4:46pm Oct 19, 2019 4:46pm
  •  fx-lover
  • | Joined May 2017 | Status: Member | 12 Posts
Quoting mrdfx
Disliked
{quote} Well lot size would depend on your account size and risk tolerance? For testing over the last 3 months I have been using 0.01 only to count the profitability of profit in pips, but going forward I will probably use 1% risk per pair and increase the risk over time if it does well.
Ignored
We can't calculate risk if we don't know stop loss in pip??
 
1
  • Post #16
  • Quote
  • Oct 19, 2019 4:49pm Oct 19, 2019 4:49pm
  •  hibra68
  • Joined Apr 2015 | Status: Member | 1,101 Posts
I would like to help.

I'm trying something new, its not a system yet.

I'm manually keeping track of sentiment.

I downloaded "sentiment indicator" from fxssi website.

The only thing is it doesn't show historical data on sentiment. So I cant really back test it to see how price reacts to change in sentiment.

The idea is to go against the herd.

For example if the indicator shows 60% or above buying it will say short and vice versa.

I started 2 days ago and i'm just loggin percentage values for each pair everyday.

For example I want to see percentage value to go from 85% to the other side -60% and see how it effects the price movement.

And we can take trades based on the candle system. If all green and the sentiment is 60% or above sell than we buy.

There could be other filters added: For example don't take trades that go against each other.
If we have a buy signal for EurUsd and a sell signal for Eurcad don't take both signals only the better one. You don't want to sell one Eur and buy the other Eur.

I will post the indicator here but I don't know if it can be copied.

If you are not able to copy it from here, download from this link. https://fxssi.com/fxssi-sentiment-lite-mt4
Attached Image (click to enlarge)
Click to Enlarge

Name: OANDA - MetaTrader.png
Size: 124 KB
Attached File(s)
File Type: ex4 FXSSI.Sentiment.Lite.ex4   103 KB | 1,596 downloads
 
 
  • Post #17
  • Quote
  • Oct 19, 2019 5:09pm Oct 19, 2019 5:09pm
  •  Go5
  • Joined Jun 2014 | Status: Invisible | 1,393 Posts
Quoting mrdfx
Disliked
{quote} Well lot size would depend on your account size and risk tolerance? For testing over the last 3 months I have been using 0.01 only to count the profitability of profit in pips, but going forward I will probably use 1% risk per pair and increase the risk over time if it does well.
Ignored
Empirical it is then, until obtaining some formula, taking into account the risk, average weekly excursions (favourable & adverse) per pair and the number of pairs traded every week.
 
 
  • Post #18
  • Quote
  • Oct 19, 2019 5:46pm Oct 19, 2019 5:46pm
  •  flashpaul
  • Joined Sep 2013 | Status: Member | 265 Posts
This is the way I love to work. Thank you to open this thread. Go on.
 
1
  • Post #19
  • Quote
  • Oct 19, 2019 10:27pm Oct 19, 2019 10:27pm
  •  Macd-rsi
  • Joined Oct 2019 | Status: Forexian Fighter = FF | 11,350 Posts
general rule:
probability = 0.80 = 80%
if 7 consecutive candles are green, #8 will be red. and opposite is right!
Be yourself
 
 
  • Post #20
  • Quote
  • Oct 20, 2019 12:47am Oct 20, 2019 12:47am
  •  Anthony1994
  • | Joined Oct 2019 | Status: Junior Member | 1 Post
Quoting tenthman
Disliked
{quote} Nope ... that just moves the rectangular gibberish to the right. If it works for you, just send the template. {image}
Ignored
How can I get this indicator
 
 
  • Trading Systems
  • /
  • Follow the Candles
  • Reply to Thread
    • Page 1 23456 59
    • Page 1 234 59
0 traders viewing now
  • More
Top of Page
  • Facebook
  • Twitter
About FF
  • Mission
  • Products
  • User Guide
  • Media Kit
  • Blog
  • Contact
FF Products
  • Forums
  • Trades
  • Calendar
  • News
  • Market
  • Brokers
  • Trade Explorer
FF Website
  • Homepage
  • Search
  • Members
  • Report a Bug
Follow FF
  • Facebook
  • Twitter

FF Sister Sites:

  • Metals Mine
  • Energy EXCH
  • Crypto Craft

Forex Factory® is a brand of Fair Economy, Inc.

Terms of Service / ©2023