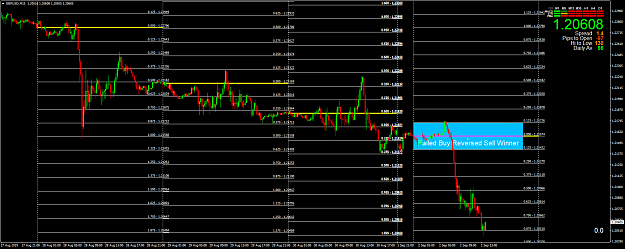
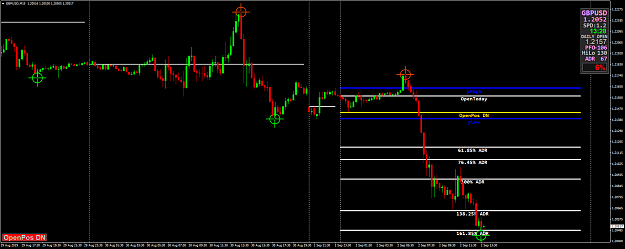
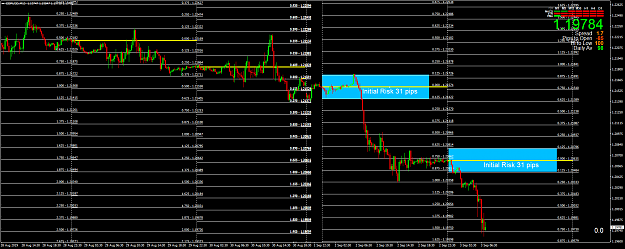
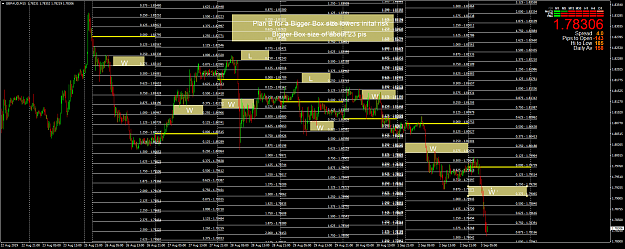
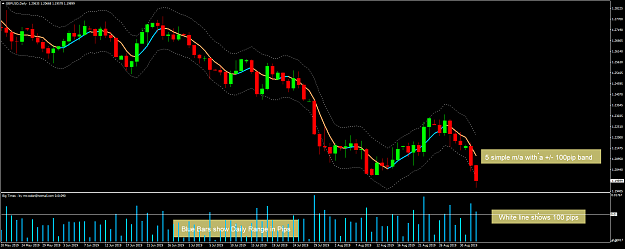
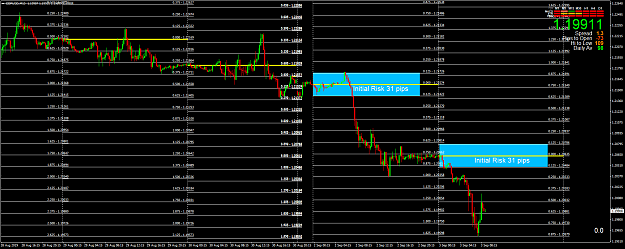
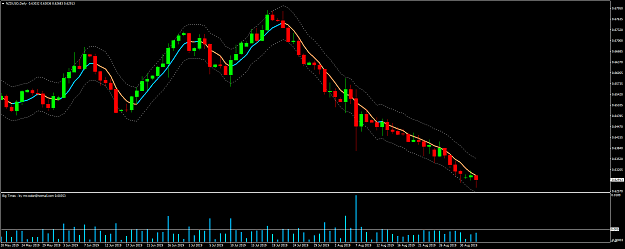
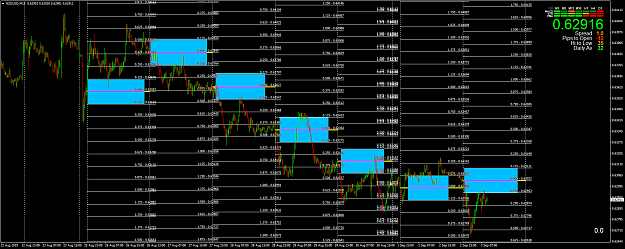
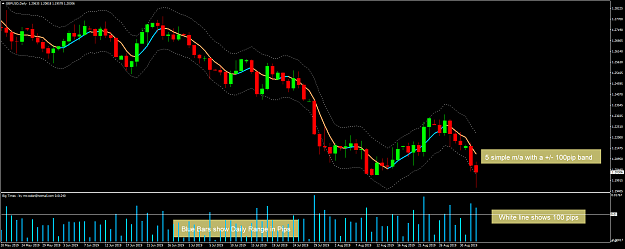
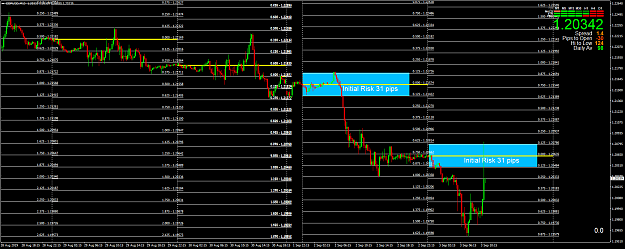
In the LazyTMA thread I and other members have posted some ideas related to daily open trading.
I think that for lazy traders is important to have statistical data for the intervals of trading grids.
Sure, the Gann ATR-fractions are a good tool and I just want to analyze the idea with the distances from Open to the Highs/Lows.
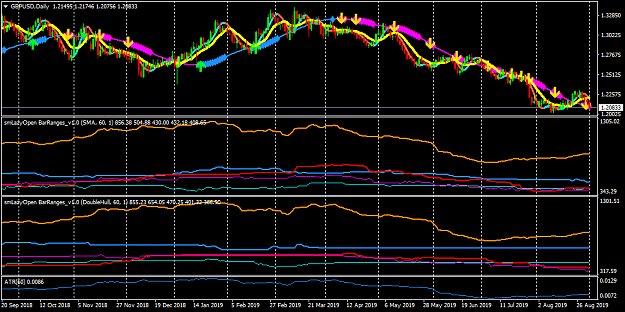
Here is an indicator "smLazyOpen BarRanges_v1.0"
with which these figures are calculated separately for rising and falling trends.
In further indicators, I will use the DoubleHull indicator, so that a possible analysis for the match of the fast and slow Hull average can be made.
Attached File(s)
