I had the circle script that was shared on this thread converted to a indicator. Much more user friendly and also stays in place when changing time frames. {file}
Ignored
Much appreciated....my old script is wonky at times ...thank you for posting that.....'traders helping traders is a fine quality'
The software you refer to is a paid program and should not be promoted here unless you can show proof of concept. I have looked at it and all it does is add a bunch of lines that mean very little to actually bring you to a decision to pull the trigger on a trade. I have not seen even one trade that was taken as a result....but it is pretty...lol
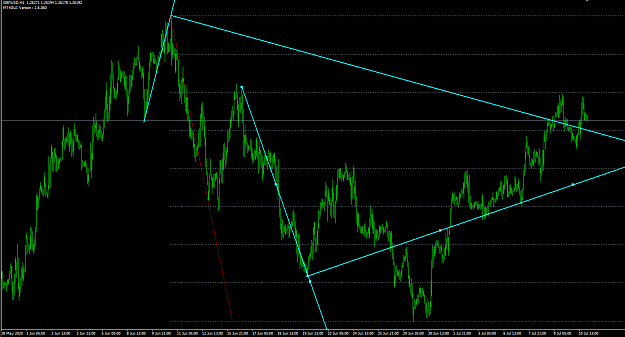
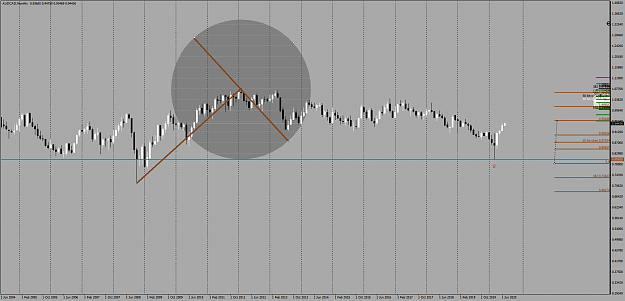
I have spent hours trying to duplicate Swede's chart in post on the last page, post 2205 with no luck. My impulse lines always come out above or below his. 1 hour chart, GPBUSD, scale fix is checked. I am using the protractor method, with broker forex.com.
I am thinking it must be my monitor setup or my broker.
Now what is interesting is that I do show potential entries with support from the impulse lines and octave lines. Actually my entries look to be trend following and maybe better??
{quote} The software you refer to is a paid program and should not be promoted here unless you can show proof of concept. I have looked at it and all it does is add a bunch of lines that mean very little to actually bring you to a decision to pull the trigger on a trade. I have not seen even one trade that was taken as a result....but it is pretty...lol
Ignored
I'm sorry about the software. I didn't notice it was paid software.
Hi everyone, I have spent hours trying to duplicate Swede's chart in post on the last page, post 2205 with no luck. My impulse lines always come out above or below his. 1 hour chart, GPBUSD, scale fix is checked. I am using the protractor method, with broker forex.com. I am thinking it must be my monitor setup or my broker. Now what is interesting is that I do show potential entries with support from the impulse lines and octave lines. Actually my entries look to be trend following and maybe better?? Any thoughts?...
Ignored
Dave...make your bars one size larger....and try again....I have been using this setting for a couple years....I have a 17 inch rectangular screen...and don’t scale fis for now since this is the current page...I only scale fix when going into history...
Hi everyone, I have spent hours trying to duplicate Swede's chart in post on the last page, post 2205 with no luck. My impulse lines always come out above or below his. 1 hour chart, GPBUSD, scale fix is checked. I am using the protractor method, with broker forex.com. I am thinking it must be my monitor setup or my broker. Now what is interesting is that I do show potential entries with support from the impulse lines and octave lines. Actually my entries look to be trend following and maybe better?? Any thoughts?...
Ignored
bro you're almost there...adjust your bars a bit higher...you're on the right path...swede rocks...keep the faith...peace
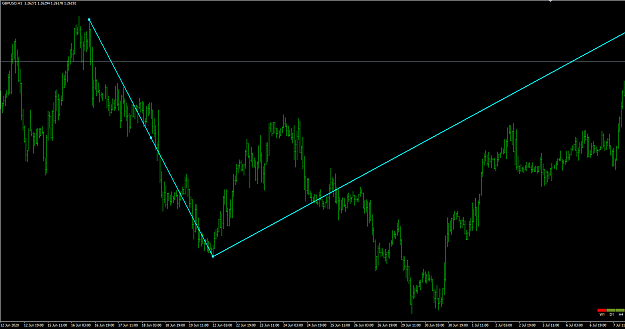
{quote} When you say bars larger, I assume you mean hit the magnify +... My vertical scale is at its max Here is what I get?? thank you!!!! {image}
Ignored
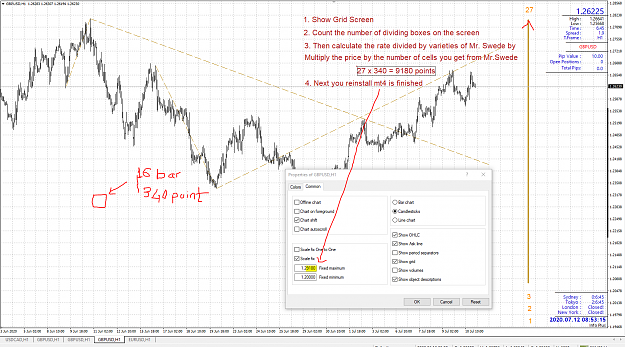
If you want to copy his experience. Please review his scaling through the pictures that Mr. Swede shared. I showed you this way to make it easier.
1. Look at his rate and time share on mt4.
2. Then you set up your mt4 screen to fit your computer screen.
To me, his scale seems to fit my screen.
Take a look at the picture to see more.
Notice that, for every 1 square in mt4 as shown, there will be 16 bars and 340 points. If you want each square to be 8 bars, then you would divide the ratio by dividing 2 scale prices by the price
I'm not sure if it is correct, but I think it is right now
Regarding price.......a basic teaching of WD Gann was the use of Octaves....the division of 8 just as in a musical note. Why it works, I am not the one to tell you, but if you can answer that you can also answer why 61.8 or 76.2 or 50% fib levels work often as turning points of impulse waves. I use the division of 8 all the time because I am a contrarian...someone who likes to take short term reversals opposite the prevailing trend so I can make quick $$, instead of holding for days. I am not alone, many time and price traders use variations of...
Ignored
thanks and looks interesting..will try this and murray math lines is also like that??
{quote} If you want to copy his experience. Please review his scaling through the pictures that Mr. Swede shared. I showed you this way to make it easier. 1. Look at his rate and time share on mt4. 2. Then you set up your mt4 screen to fit your computer screen. To me, his scale seems to fit my screen. Take a look at the picture to see more. Notice that, for every 1 square in mt4 as shown, there will be 16 bars and 340 points. If you want each square to be 8 bars, then you would divide the ratio by dividing 2 scale prices by the price I'm not sure...
Ignored
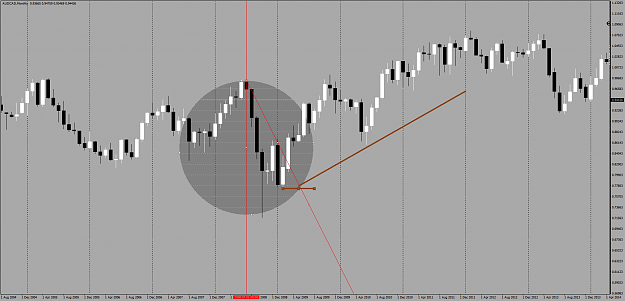
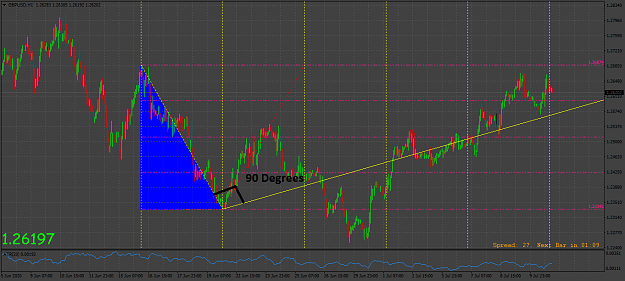
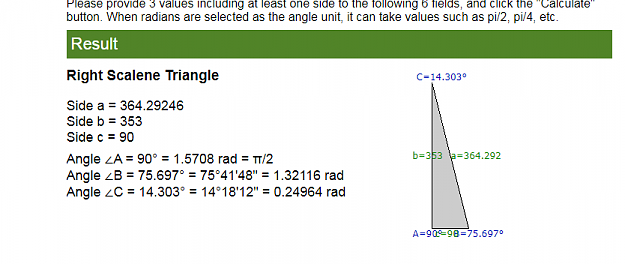
Objectivity of drawing those 90 Degree Angles is the most confusing element in my opinion. Swede is a very experienced trader, that is why his eyes automatically consider details that avarage traders (like me) do not see them.
Since the morning I have been making calculations just to find a "real" 90 degree trendline and place it on my chart. Below you can see the bearish move I took as a reference. It is marked with a blue triangle. I know it might change from Broker to Broker... but the values on my chart are:
Distance: 353 Pips
Duration: 90 Candles
So, imagine a triangle where length of a: 353 , b= 90. c= unknown for now
And if we make necessary calculations, what we get is:
c= 364,292
And inner angles of the triangle are: 14,303 + 90 + 75,697 = 180
So the angle that we can use in our formula is: 75,697
When we calculate 180 - (75,697 + 90) = 14,303
So:
The angle of the trendline we need just to draw a "real" 90 Degree trendline is 14,303
And I placed it on the chart by using a FiboFan tool...
The result I get is different than what Swede draws on his own screen.
Maybe I made some calculation mistakes. I donnow how objectivity can be removed from this approach.
Best regards to everyone
Especially, thanks to Swede who shares his hard-earned information.
{quote} Objectivity of drawing those 90 Degree Angles is the most confusing element in my opinion. Swede is a very experienced trader, that is why his eyes automatically consider details that avarage traders (like me) do not see them. Since the morning I have been making calculations just to find a "real" 90 degree trendline and place it on my chart. Below you can see the bearish move I took as a reference. It is marked with a blue triangle. I know it might change from Broker to Broker... but the values on my chart are: Distance: 353 Pips Duration:...
Ignored
Let's take a look at the overlay in swede's post 2213. Notice it puts everything in terms(chunks/divisions) of 180 degrees. We are dealing with linear charts...lines. Pprice can only go up or down.... It is linear, so that is why 180 degrees. straight line = 180 degrees. That makes sense to my peanut brain. lol
If we start from a division of 180 degrees we know where on a swing or even a bunch of swings to fit a right angle so that the right angle is dividing the Linear price that we have defined using 180 degrees. When price respects it we can say we have found what Gann called a "price vibration". At least that is my theory, for now.
I don't know if that helps your triangle experiment or not. Just my thoughts when i saw your post. Maybe it is helpful somehow? Don't go by me, I know very little about Gann trading. the only Gann book I read cover to cover was the Tunnel through the Air. Interesting book. Very mysterious.
somebody mathematical could probably use Tau or Pi to find right angles if they were so inclined as well. Triangles that are not part of a circle (or semi cirlce) would not seem to fit what Gann was teaching I don't think. Geometry of a circle, with 180 degrees being a straight line, it seems to me is what it is about.
anyway just thought I'd post my crazy thoughts!
Cheers
PS imagine Swede's overlay on the that swing you have defined(chosen) in your chart. See where price reacts on the overlay. As you guys know, MT4 sucks but
{quote} Let's take a look at the overlay in swede's post 2213. Notice it puts everything in terms(chunks/divisions) of 180 degrees. We are dealing with linear charts...lines. Pprice can only go up or down.... It is linear, so that is why 180 degrees. straight line = 180 degrees. That makes sense to my peanut brain. lol If we start from a division of 180 degrees we know where on a swing or even a bunch of swings to fit a right angle so that the right angle is dividing the Linear price that we have defined using 180 degrees. When price respects it...
Ignored
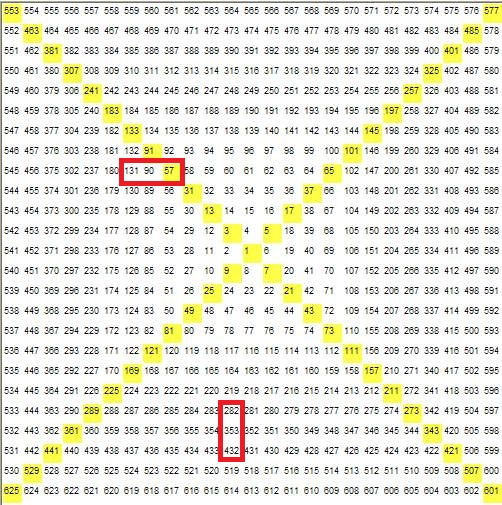
Thank you very much for your comments and for expressing your opinions. But what i think is, when GANN was emphasizing 90-45 Degree angles, he was actually referring to Square of Nine. For example let's make relevant calculations about the bearish trend that I marked with a blue triangle above.
As I told above:
Distance: 353 Pips
Duration: 90 Candles
I found those numbers in square of nine and marked 2 other numbers just next to them. (90 degree refers to North, south, east and west)
Guess what:
Characteristics of the next wave must be:
Distance: 282, 353 or 432
Duration: 57 Candles, 90 Candles or 131 Candles
And here are the characteristics of actual move:
Distance: 291 Pips (I guess here we can say that "282" worked)
Duration: 88 Candles (I guess here we can say that "90 Candles" worked)
This is what I understand from "90 Degrees"
I know I shudnt change the main theme of the discussion, but I just wanted to share my opinion.
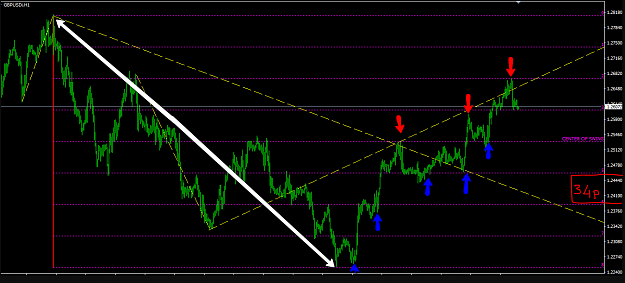
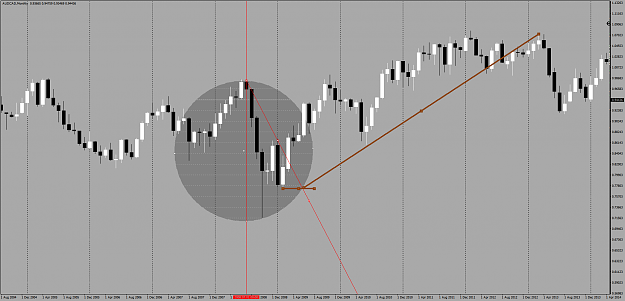
Now some like to square time and price so your cycles lines equal the distance between octave horizontal lines...you can use your circle tool to measure and your chart will look more like this... {image} {image}
Ignored
The graphic of that post shows a cross-hairs making 90 degrees from the center of the circle. Just an observation.
{quote} Thank you very much for your comments and for expressing your opinions. But what i think is, when GANN was emphasizing 90-45 Degree angles, he was actually referring to Square of Nine. For example let's make relevant calculations about the bearish trend that I marked with a blue triangle above. As I told above: Distance: 353 Pips Duration: 90 Candles I found those numbers in square of nine and marked 2 other numbers just next to them. (90 degree refers to North, south, east and west) Guess what: Characteristics of the next wave must be:...
Ignored
TY for the reply.
I wouldn't know. Like I said just trying to add to the discussion FWIW. Feel free to ignore my crazy experiments as well! lol.
{quote} Objectivity of drawing those 90 Degree Angles is the most confusing element in my opinion. Swede is a very experienced trader, that is why his eyes automatically consider details that avarage traders (like me) do not see them. Since the morning I have been making calculations just to find a "real" 90 degree trendline and place it on my chart. Below you can see the bearish move I took as a reference. It is marked with a blue triangle. I know it might change from Broker to Broker... but the values on my chart are: Distance: 353 Pips Duration:...
Ignored
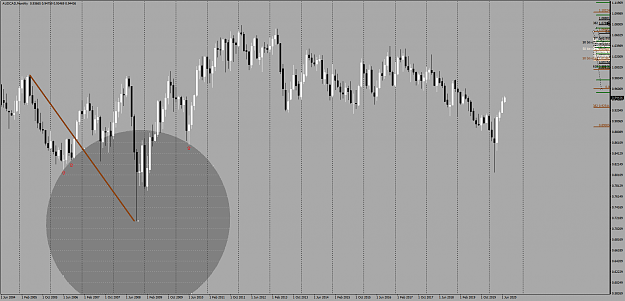
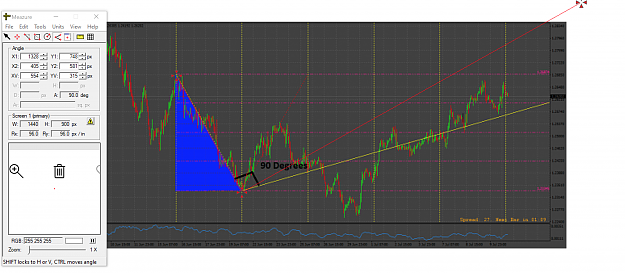
This is an overkill of very simple concept. 90degree is plain and simple 90 degree as taught in school, use on screen overlay tools to cross check.
{quote} This is an overkill of very simple concept. 90degree is plain and simple 90 degree as taught in school, use on screen overlay tools to cross check. {image} the tool is posted here: maneverfix replied Jun 8, 2020
Ignored
Maybe you are right...maybe I was exaggrating things...
{quote} Objectivity of drawing those 90 Degree Angles is the most confusing element in my opinion. Swede is a very experienced trader, that is why his eyes automatically consider details that avarage traders (like me) do not see them. Since the morning I have been making calculations just to find a "real" 90 degree trendline and place it on my chart. Below you can see the bearish move I took as a reference. It is marked with a blue triangle. I know it might change from Broker to Broker... but the values on my chart are: Distance: 353 Pips Duration:...
Ignored
That just simply is not a 90 degree angle.....sorry....just looking at it clearly not a right angle...great discussion all!
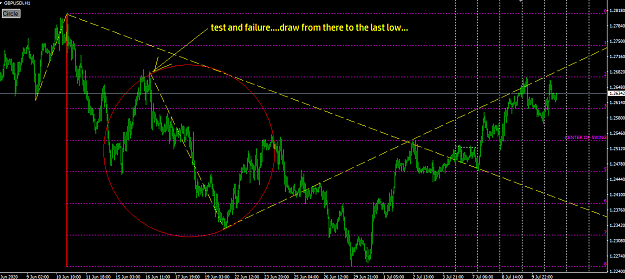
Try to tweak the drawing...I started to draw this impulse from the test and failure...should be close...
{quote} If you want to copy his experience. Please review his scaling through the pictures that Mr. Swede shared. I showed you this way to make it easier. 1. Look at his rate and time share on mt4. 2. Then you set up your mt4 screen to fit your computer screen. To me, his scale seems to fit my screen. Take a look at the picture to see more. Notice that, for every 1 square in mt4 as shown, there will be 16 bars and 340 points. If you want each square to be 8 bars, then you would divide the ratio by dividing 2 scale prices by the price I'm not sure...
Ignored
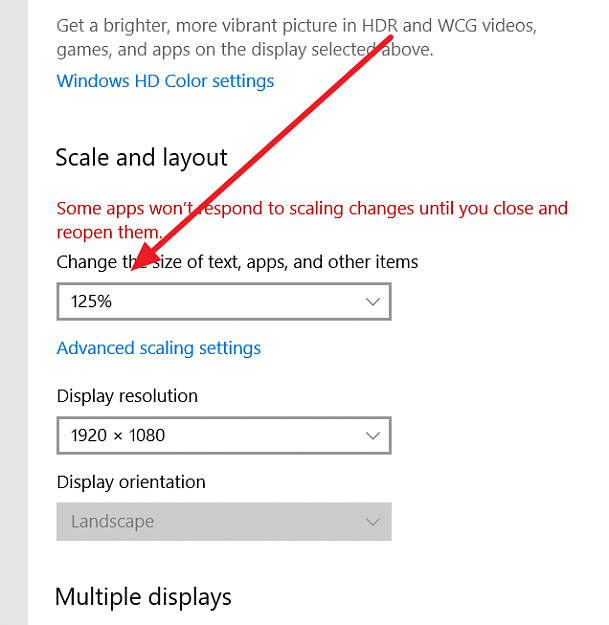
All, I found out why my charts were not matching up with Swede's. I run a resolution of 1920x1080. I changed my windows display scale from 100 to 125%.
What is interesting though is that even though my scale was off, I still saw entries off the trend lines.