• Home
  • Forums
  • Trades
  • News
  • Calendar
  • Market
  • Brokers
  • Login
  • Join
  • User/Email: Password:
  • 1:46pm
Menu
  • Forums
  • Trades
  • News
  • Calendar
  • Market
  • Brokers
  • Login
  • Join
  • 1:46pm
Sister Sites
  • Metals Mine
  • Energy EXCH
  • Crypto Craft

Options

Bookmark Thread

First Page First Unread Last Page Last Post

Printable Version

Similar Threads

ECN && STP && Scalping && Hedging - Broker Review - Oct 2009 24 replies

Market Profile And Volume Profile MT5 0 replies

1M & 5M Scalping System (Scalping Paradise) 21 replies

Market profile trader-Merged profile 0 replies

  • Commercial Content
  • /
  • Reply to Thread
  • Subscribe
  • 19
Attachments: Ultimate Scalping & Market Profile
Exit Attachments

Ultimate Scalping & Market Profile

  • Post #1
  • Quote
  • First Post: Edited Aug 7, 2019 3:29am Jun 19, 2019 5:03am | Edited Aug 7, 2019 3:29am
  •  AndrewBa-
  • | Commercial Member | Joined Nov 2016 | 422 Posts

Ultimate Scalping & Market Profile


Major change: I have created another thread, that covers all I've done until now and delivers a more convenient way to trade:

https://www.forexfactory.com/showthread.php?t=938414


Very often we hear, that with mt4 it is impossible to trade the market via Volume Analysis or Market Profile.
So, is that really true?!

As you can see by statistics, the largest CFD forex brokers - ICMarkets, Forex.com, XM, SaxoBank, Oanda and Exness - already have a cumulated average volume of 80 billion US Dollar each day. Other CFD brokers cover together about 90 billion US Dollar.
So we talk about an average volume of 170 billion US dollar transactions, each day!
Source: http://www.wvwv.org/forex-brokers/la...x-brokers.html

Shall we really let this pass us by, or shouldn't we try to analyze it to gather some input for our trading strategy?!

This is what this thread will be about...

Ultimate Scalping:

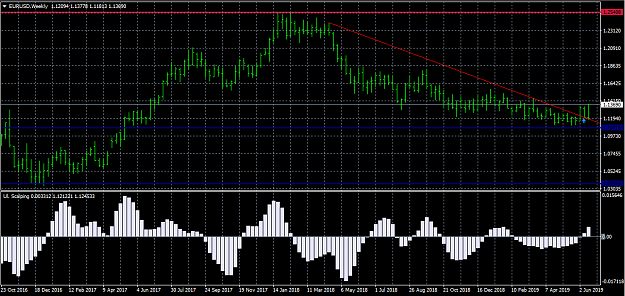
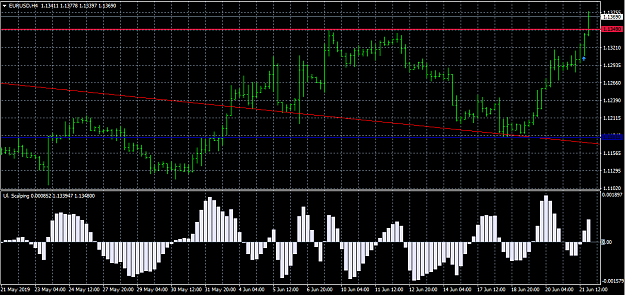
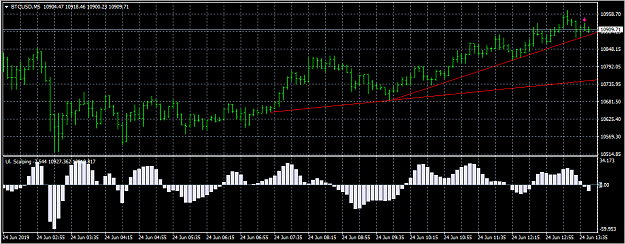
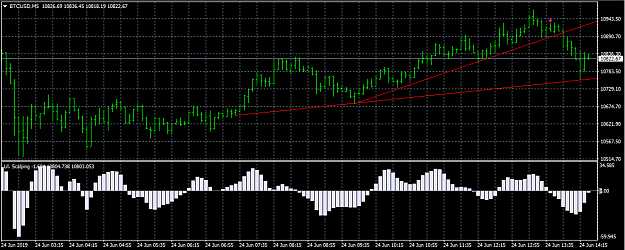
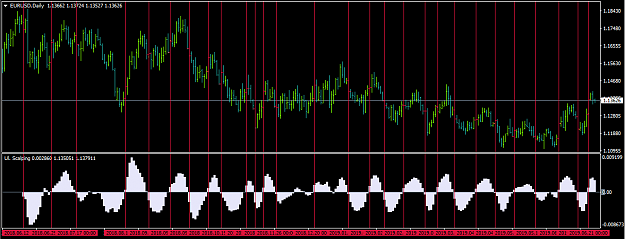
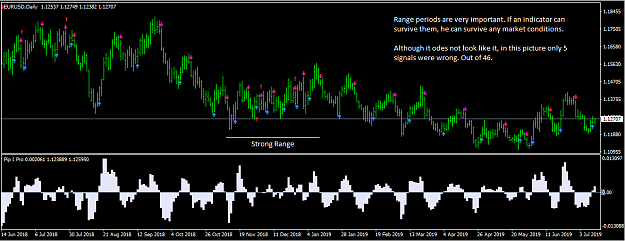
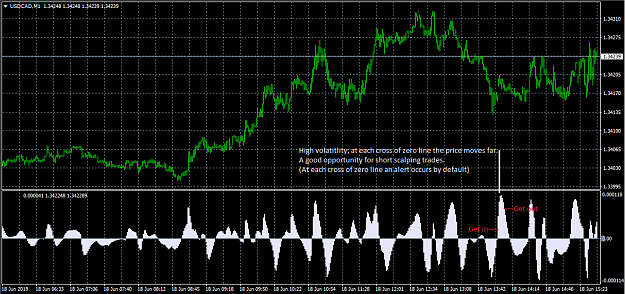
But first, have a look at my scalping indicator, which will help us in near future to trade the Market Profile:
- Adjustable Periods must have a higher value than Fixed Periods; please make sure to set Flat Filter to true -
New version:
Attached File
File Type: ex4 Pip I Pro.ex4   62 KB | 286 downloads | Uploaded Jul 9, 2019 7:04am

Adj Periods 8, Fixed Periods 3, Flat = true
Attached Image (click to enlarge)
Click to Enlarge

Name: 8 3 1 3 daily.PNG
Size: 40 KB

Old version:
Attached File
File Type: ex4 Ultimate Scalping, Trial.ex4   50 KB | 229 downloads

Attached Image (click to enlarge)
Click to Enlarge

Name: spike1.PNG
Size: 45 KB


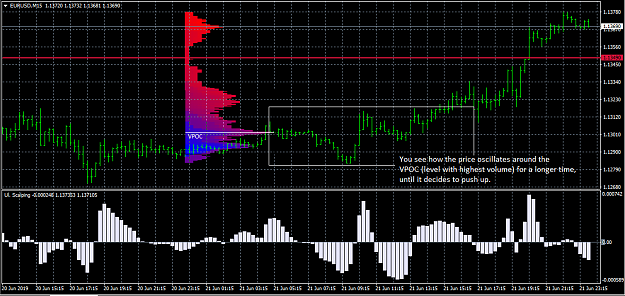
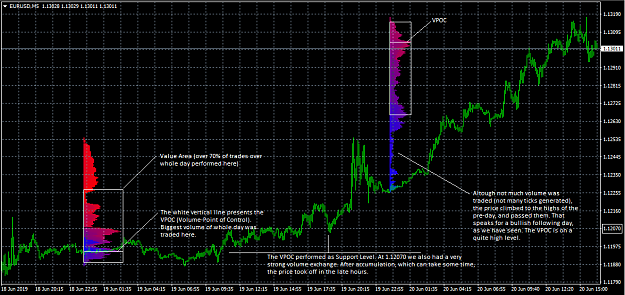
Market & Cluster Profile:
Attached Image (click to enlarge)
Click to Enlarge

Name: Market Profile.PNG
Size: 66 KB

- A new Market Profile indicator, that depends on real ticks, will be uploaded shortly -

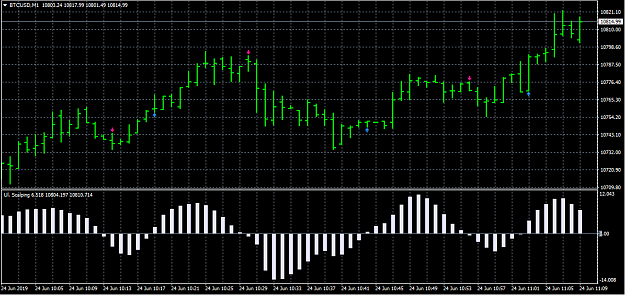
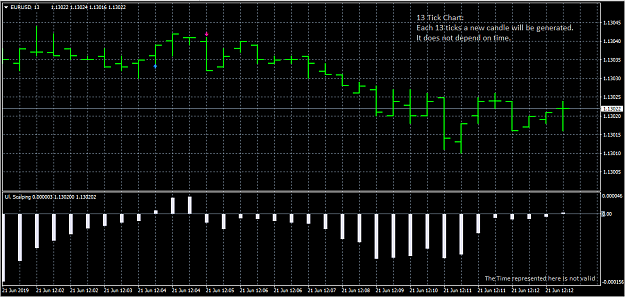
Tick Chart Indicator:

When you activate the indicator, a new chart-window is being opened. Do not close the original chart you activated the indicator on; it needs to remain open.
You can activate other indicators on the tick chart, for ex. the Ultimate Scalping.
Attached Image (click to enlarge)
Click to Enlarge

Name: sc example.PNG
Size: 34 KB

Attached File
File Type: ex4 Tick Chart.ex4   9 KB | 178 downloads | Uploaded Jun 22, 2019 8:03am


Additional Indicators:

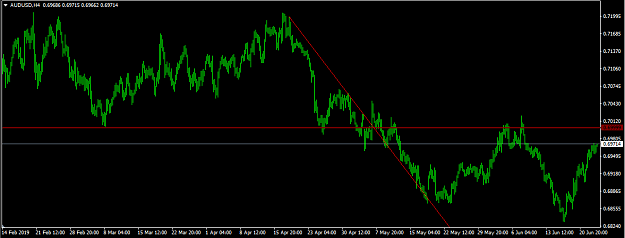
Auto Trendline Drawing indis:
Attached File
File Type: zip Auto Trendline.zip   121 KB | 251 downloads | Uploaded Jun 20, 2019 8:44am


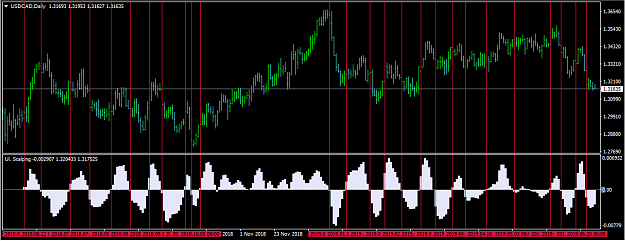
Support and Resistance indis:
Attached File
File Type: zip Collection S&R Indicators.zip   434 KB | 228 downloads | Uploaded Jun 20, 2019 7:01am


Currency Strength Meter indis:
Attached File
File Type: zip Currency Strength Meter.zip   96 KB | 213 downloads | Uploaded Jun 20, 2019 7:54am


Make sure to have enough historical data in your mt4 to have the indicators working correctly.


More about to come...
Check page 1 for all infos...
  • Post #2
  • Quote
  • Jun 20, 2019 6:02am Jun 20, 2019 6:02am
  •  Dingoman-two
  • Joined Aug 2017 | Status: Just a little Aussi Battler | 3,759 Posts
Quoting AndrewBa-
Disliked
Ultimate Scalping & Market Profile Very often we hear, that with mt4 it is impossible to trade the market via Volume Analysis or Market Profile. So, is that really true?! As you can see by statistics, the largest CFD forex brokers - ICMarkets, Forex.com, XM, SaxoBank, Oanda and Exness - already have a cumulated average volume of 80 billion US Dollar each day. Other CFD brokers cover together about 90 billion US Dollar. So we talk about an average volume of 170 billion US dollar transactions, each day! Source: http://www.wvwv.org/forex-brokers/la...x-brokers.html...
Ignored
Hi AndrewBa,

I am a scalper at best and I am going to be very interested in your thread my friend, let's see how it goes.

"As always trade wisely folks,And then with Patience,time will reveal all"
  • Post #3
  • Quote
  • Jun 20, 2019 10:35am Jun 20, 2019 10:35am
  •  AndrewBa-
  • | Commercial Member | Joined Nov 2016 | 422 Posts
Quoting Dingoman-two
Disliked
{quote} Hi AndrewBa, I am a scalper at best and I am going to be very interested in your thread my friend, let's see how it goes.
Ignored
Hi,

thanks for your participation.
Need to upload some additional indicators and then we are good to go.

Check page 1 for all infos...
1
  • Post #4
  • Quote
  • Jun 20, 2019 12:15pm Jun 20, 2019 12:15pm
  •  Dingoman-two
  • Joined Aug 2017 | Status: Just a little Aussi Battler | 3,759 Posts
Quoting AndrewBa-
Disliked
{quote} Hi, thanks for your participation. Need to upload some additional indicators and then we are good to go.
Ignored
Looking forward to it my friend,

"As always trade wisely folks,And then with Patience,time will reveal all"
  • Post #5
  • Quote
  • Jun 20, 2019 1:17pm Jun 20, 2019 1:17pm
  •  ganam
  • | Joined Feb 2012 | Status: Member | 742 Posts
GREAT
follow the flow of music $
  • Post #6
  • Quote
  • Jun 22, 2019 3:56am Jun 22, 2019 3:56am
  •  AndrewBa-
  • | Commercial Member | Joined Nov 2016 | 422 Posts
Quoting ganam
Disliked
GREAT
Ignored
Thanks.
Check page 1 for all infos...
  • Post #7
  • Quote
  • Jun 22, 2019 4:03am Jun 22, 2019 4:03am
  •  AndrewBa-
  • | Commercial Member | Joined Nov 2016 | 422 Posts
So, what does a Tick consist of?!

A Tick is being generated, when a Trade was Opened or Closed.
Unfortunately we cannot see how many lots were traded on that particular Trade, but we can predict:
If there any many ticks on a specific price level, then this is a very important level to watch.
It can perform as Supply & Demand > Support & Resistance Level.

And this is how the price is generated. By interactions of traders, investment funds, hedge fonds etc. (also called sentiment).

What else we can see is, whether it is a postitive tick or a negative one. This indicates the direction, in which the price went for last transaction.

Big Players do not always find the desirable volume for their transaction at the current level.
This is why they open Pending Orders. We cannot see those Pending Orders, as they do not perform as actual ticks in the chart [they are not being traded right now], but they also move the market, once they are presented in the order book (some brokers offer their traders their order book).
However, we can take action when these orders get fulfilled.

Shortly I will upload a tick chart indicator in the first post, so you can see and analyze the ticks.

Important things you have to know, regarding ticks & volume:

- Ticks let us identify important Supply & Demand levels much easier (more reliable) than minute charts.
- Ticks tell us if a price level is important (many ticks > many transactions) or not. If many transactions were performed, it is very likely that the price can move onto this price level again in future.
- This is why it is very often better to trade towards important price levels, than away from them [but not always].
- This price level is one, that many market contributors are much more likely to use to perform their transactions here, than on another random level.

- The way a trading day goes, is very often already decided during the first 15 minutes after Market Open:
If many ticks are being performed (more than the average trading day), you can guess that this will be a strong trend day; hard to re-catch if missed.
If an average of ticks is being performed, it will be an average trading day, with some ranges / or pullbacks.
If a lot fewer ticks are being generated than usual, it will be a low volatility range day, and it will be hard to trade it, as the volume is low, and algorithms can turn the price movement into something completely unpredictable.
This is also something we as traders have to face in future a lot more: Algorithms of big players try to fake price movements and show us patterns, that are not valid.

- Very often it is interesting to observe and analyze the tick behaviour 15-30 minutes before Market Open (especially for indices).
Sometimes things repeat themself again and again.
Check page 1 for all infos...
  • Post #8
  • Quote
  • Edited Jun 24, 2019 7:33pm Jun 23, 2019 4:33am | Edited Jun 24, 2019 7:33pm
  •  AndrewBa-
  • | Commercial Member | Joined Nov 2016 | 422 Posts
Looks like a system, that calculates some new bars, Moving Averages & Oscillator Stats from the past...
This fits perfect into the new topic I wanted to mention either way:

The truth about the "Retail Market"

What you see in the charts above - and what you in general see in charts from mt4/5 - are retail indicators.
They all work the same way: Their recent value is being calculated by the past values, the price has passed.

Now, is that really helping us?!

There might be some tools & features in every charting-software that can help us.
For ex. the ability to draw (auto-draw) Support & Resistance / Trend Lines on a monthly, weekly and daily basis.
-Don't forget to always have some good historical data in your mt4 to be able to do that.

But that's actually it. Some people swear that they use Fibonacci Retracements, Pivot Lines successful.
And I don't say its not true. Fibo Levels indeed can act as important hints on the 4h chart, but not always and mostly rather for exiting a trade.

However, what I am trying to say is that you can actually forget about all the other stuff, like MACD, RSI, CCI and so on...

It won't help you and it won't show you something at all, that you don't already see with your own eyes. You don't need to rely on past values stuff.
This is my point of view.

What is much more important is the correct analysis and definition of reliable, real Support and Resistance Levels.
By figuring out, on which levels most trades were done; so no one - no indicator - has to tell you, if a market is oversold or overbought, expensive or cheap.

I have just plotted some important S&R / Trend Lines into the E/U chart:

Attached Image (click to enlarge)
Click to Enlarge

Name: EU weekly SR.PNG
Size: 45 KB


Attached Image (click to enlarge)
Click to Enlarge

Name: EU 4h SR.PNG
Size: 46 KB


By the way we have a very strong buy signal in EUR/USD right now.

Next we need to add the Market Profile Indicator on the 30 or 15 min. Chart and we can already see if the current price - in comparisment to the real S&R levels, high tick data value areas - is high or low, expensive or cheap.

You see here how it might look. I have used a recent Market Profile indi, which is not finished yet in coding, but you can see clearly where the big areas of high volume are, and how, after the price breaks through, a new level develops.
Attached Image (click to enlarge)
Click to Enlarge

Name: eu ex. 15 min.PNG
Size: 46 KB
Check page 1 for all infos...
  • Post #9
  • Quote
  • Edited at 1:41pm Jun 24, 2019 4:15am | Edited at 1:41pm
  •  AndrewBa-
  • | Commercial Member | Joined Nov 2016 | 422 Posts
Bitcoin has reached another 5-month high, nice volatility in 1-min. Chart

Attached Image (click to enlarge)
Click to Enlarge

Name: 24.6 BTCUSD.PNG
Size: 34 KB

Adjustable Periods = 14 and Fixed Periods = 7

Other securities to watch are Gold and Oil because of a) trade negotiations between USA and China and b) the Iran crisis; EUR/USD and S&P500 are also interesting.


And here you can see clearly, how important Trend and S&R Lines are:

The Analysis in 5 min-Chart:
Attached Image (click to enlarge)
Click to Enlarge

Name: btc 5 min 2.PNG
Size: 38 KB


The reaction, after the Trend Line was broken:
Attached Image (click to enlarge)
Click to Enlarge

Name: btc plan.PNG
Size: 33 KB


So this is where the Smart Money goes. The price has even touched the bottom trend line, and accumulated back up, after its rapid fall.
I was knocked out by Trailing-Stop
Check page 1 for all infos...
  • Post #10
  • Quote
  • Jun 24, 2019 2:59pm Jun 24, 2019 2:59pm
  •  Hutch
  • Joined Apr 2010 | Status: Lazy trader on D1 charts | 4,498 Posts
Quoting AndrewBa-
Disliked
{quote} Looks like a system, that calculates some new bars, Moving Averages & Oscillator Stats from the past... This fits perfect into the new topic I wanted to mention either way: The truth about the "Retail Market" What you see in the charts above - and what you in general see in charts from mt4/5 - are retail indicators. They all work the same way: Their recent value is being calculated by the past values, the price has passed. Now, is that really helping us?! There might be some tools & features in every charting-software that can help us. For...
Ignored
Hi Andrew. I very much appreciate your reply. Unfortunately no indicator will tell us what the future holds so we must concentrate on the information that is available to us. Thanks for the insight.
  • Post #11
  • Quote
  • Last Post: Jun 25, 2019 5:39am Jun 25, 2019 5:39am
  •  AndrewBa-
  • | Commercial Member | Joined Nov 2016 | 422 Posts
Quoting Hutch
Disliked
{quote} so we must concentrate on the information that is available to us. Thanks for the insight.
Ignored
Totally agree.
Information, that influences the movement of the price, but is sometimes hidden to us, because we overload our charts with unnecessary Wave indicators, that no one needs.
What is an MA, MACD or CCI, RSI compared to simple Support and Resistance Levels?!

This is where the smart money is going.

Attached Image (click to enlarge)
Click to Enlarge

Name: audusd 4h.PNG
Size: 34 KB


Now imagine that chart with an indepth-view of real tick & volume data...

Levels of different anticipation, price acceptance by big players, delta weight and a lot more.
The key to this all in my view is the trading direction: from low tick notes to areas with high volume and tick notes.
And you will indeed do your best to be on the right side.

.
The difference is, that we sometimes need an indicator or a confirmation-signal to initate us to begin a trade.

And this is when Wave indicators, or the measuring of prohabilites, come into the game.

Have a look at the Ultimate Scalping indicator on a daily basis.

The Buy/Sell signal is very good, you just need to know when to exit. And this is done either by Chart Analysis or Fundamental News.

Attached Image (click to enlarge)
Click to Enlarge

Name: USD CAD daily signal 14- 7.PNG
Size: 57 KB


Attached Image (click to enlarge)
Click to Enlarge

Name: EUR USD daily signal 14- 7.PNG
Size: 29 KB
Check page 1 for all infos...
1
  • Commercial Content
  • /
  • Ultimate Scalping & Market Profile
  • Reply to Thread
0 traders viewing now
Top of Page
  • Facebook
  • Twitter
About FF
  • Mission
  • Products
  • User Guide
  • Media Kit
  • Blog
  • Contact
FF Products
  • Forums
  • Trades
  • Calendar
  • News
  • Market
  • Brokers
  • Trade Explorer
FF Website
  • Homepage
  • Search
  • Members
  • Report a Bug
Follow FF
  • Facebook
  • Twitter

FF Sister Sites:

  • Metals Mine
  • Energy EXCH
  • Crypto Craft

Forex Factory® is a brand of Fair Economy, Inc.

Terms of Service / ©2021