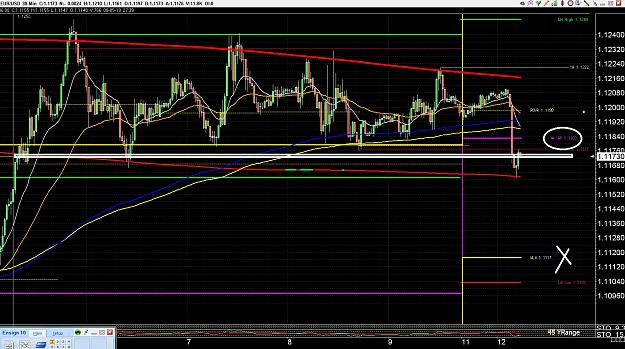
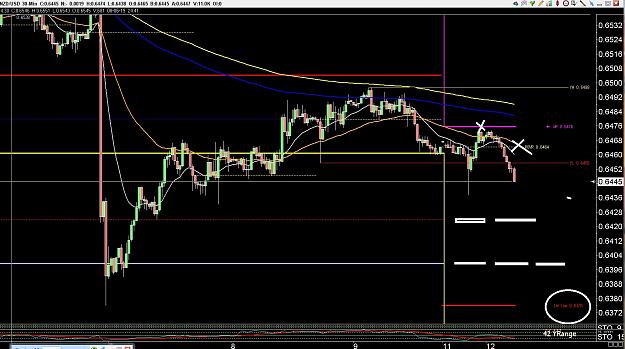
Daily chart ,, beside the 200 ,, ya got the 50 day moving average is a biggie ,, 5 day or basically our little weekly ave price tht works well with the ole 8 hour stochs and the previous high ,, low and midpoint thing ,, which it appears without measuring is the sticky point atm ,, same ole same ole ,, right down the line ,, nothing new or any different than any other thing traded which when ya slap tht hourly temp on a daily its all right there lol,, not magical ,, not mystical,, just the same ole same ole 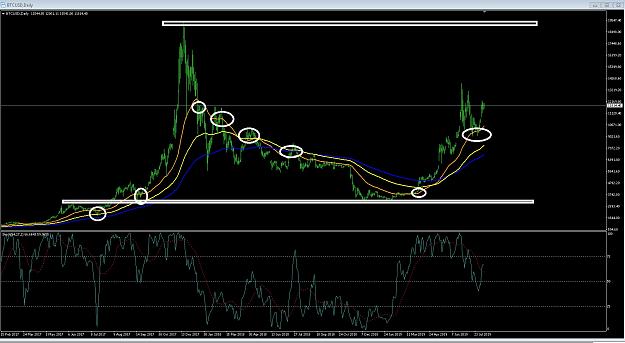
Attached Image (click to enlarge)
3