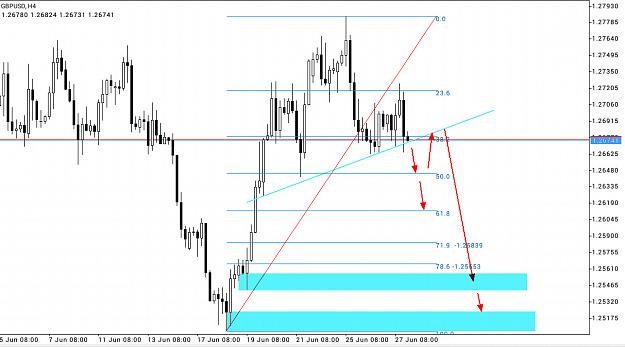
{quote} Yes head and shoulders on daily chart. Breaking below 1.6260 may cause selling. We’ll see hoping for a big red candle tomorrow so I don’t have to hold over weekend.
Ignored
Man - u plan ahead.....predicting a head and shoulders on the daily when not even half of it is complete......just looks like a bit of a pullback to me in an uptrend. Fingers crossed for u! Fair play if it plays out
above monthly above weekly above daily and still above 4 hour 200 ,, its really not a picture of big time bear ,, lol, just saying ,,and your gonna worry about a week end ,,,, is it worth it really is it
Ignored
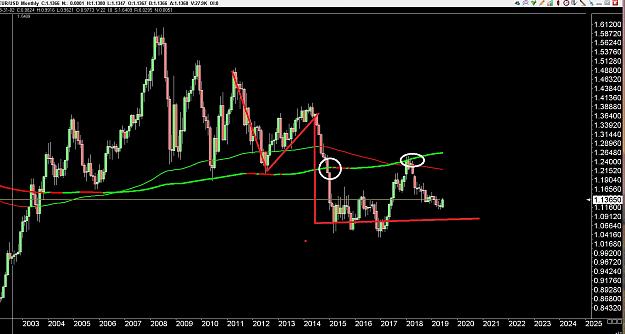
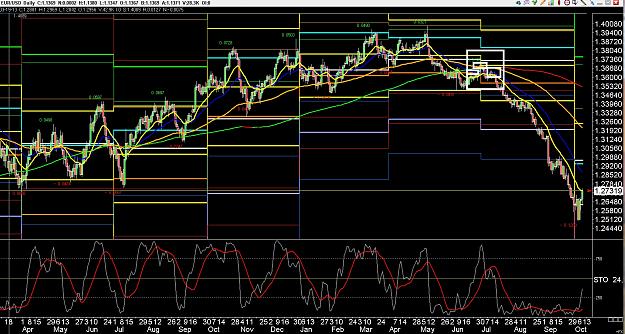
Well is a strong signal on daily. I don’t trade monthly as I’d be in trades late. But there was one place on monthly EURUSD chart that I would have taken short but wasn’t trading currency at the time. I would have shorted July of 2014 that was a tight breakout. Wish I could find something like this to be in a short for months
Aah sorry guys, I was mad at myself for doing stupid shit and being a baby Digs, I think you're right, I do spend a lot of time looking at short timeframes and I think all the wiggling back and forth is messing with me. Last night, after a good Asian session down and the initial strong push in London led me to believe that we might have some good movement... but afterwards the action was choppy and that's always where I get torn up. I need to work on patience and watching those HTF levels... but I also wanna be able to trade like Digs and...
Ignored
I know bud ,, digs takes a lot of swings some days lol,, some days those plus ones add up ha ,, just got to remember not to feel like ya missed something because ya didnt ,, always another ride bud ,,
{quote} Well is a strong signal on daily. I don’t trade monthly as I’d be in trades late. But there was one place on monthly EURUSD chart that I would have taken short but wasn’t trading currency at the time. I would have shorted July of 2014 that was a tight breakout. Wish I could find something like this to be in a short for months
Ignored
so what was the matter with the next time ,, the same shit ya see for these daily chart swings back and forth work the same on the monthly ,, practice practice practice ,,hasent went anywhere in 6 nine moths or so but ya couldve ,
{quote} Man - u plan ahead.....predicting a head and shoulders on the daily when not even half of it is complete......just looks like a bit of a pullback to me in an uptrend. Fingers crossed for u! Fair play if it plays out
Ignored
Yes sometimes I plan ahead but this might not work could just go through neckline area so or do something else all together so I never buy the neckline area just wait for the right shoulder to form then short again there
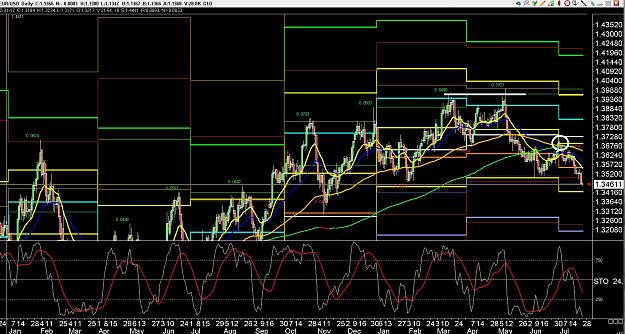
{quote} so what was the matter with the next time ,, the same shit ya see for these daily chart swings back and forth work the same on the monthly ,, practice practice practice ,,hasent went anywhere in 6 nine moths or so but ya couldve , {image}
Ignored
July 2014 was just a very small area compared to other parts on monthly chart
{quote} July 2014 was just a very small area compared to other parts on monthly chart
Ignored
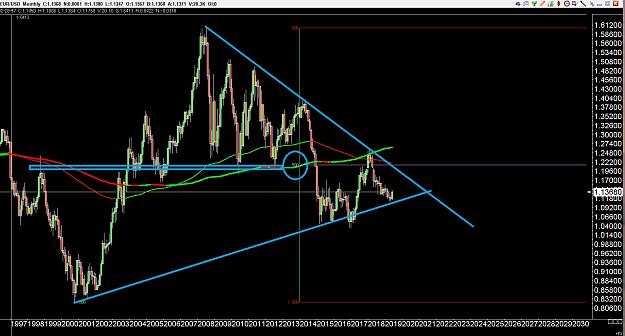
no different than any other damn time ,, except the monthly was all lined up just right ,, failure of the daily 200 ,,nothing more nothing less ,,looks no different than any other time period ,, ,, ah but the fifty level of all the data ya see on a monthly chart when ya pull it let go ,,,,,same shit different time period A high ,, a low ,, a mid point
{quote} no different than any other damn time ,, except the monthly was all lined up just right ,, failure of the daily 200 ,,nothing more nothing less ,,looks no different than any other time period ,, ,, ah but the fifty level of all the data ya see on a monthly chart when ya pull it let go ,,,,,same shit different time period A high ,, a low ,, a mid point {image}{image}
Joined Jan 2010
|
Status: The Voodoo Boodoo Club
|38,039 Posts
ya can figure it six ways to Sunday ,, its always gonna be the same shit ,,, want to know where its going ,,look at where its been and find the pieces to roll with it ,, dont fight it ,,, dont formulate stipulate and whatever the hell else ya want to do ,, trade whats is known ,, forget the bull shit ,, whats the next level above ,, whats the next below ,, and what pieces do I have
{quote} Great pick up digs. Had actually missed that
Ignored
Lol,, i dont miss much man ,, to costly ,, then after a while ya just see its the same shit over and over ,, may shoot myself in the foor here and there but Im only human lol
{quote} no different than any other damn time ,, except the monthly was all lined up just right ,, failure of the daily 200 ,,nothing more nothing less ,,looks no different than any other time period ,, ,, ah but the fifty level of all the data ya see on a monthly chart when ya pull it let go ,,,,,same shit different time period A high ,, a low ,, a mid point {image}{image}
Ignored
Its different there hasn’t been small breakout like that on monthly in a while 2014 2005 2006 id only want to be holding shorts long term though
Joined Jan 2010
|
Status: The Voodoo Boodoo Club
|38,039 Posts
back in the day the mkts used to follow main street ,,,, long removed from tht shit now a days ,, now its just a place for the super rich to park their money for their buddies to make them richer ,, a big ole fagazi ,, banks get rich on fee s for those tht let use their money ,, governments synthetically get interest rates below zero so the fat cats get even fatter getting payed to borrow money to make even more by holding the favorable interest rate swaps ,,, retailers,, just mushrooms ,, fed bullshit and kept in the dark lol ,, in the end the mkts still do the same shit the same way they always do,, lol
{quote} Its different there hasn’t been small breakout like that on monthly in a while 2014 2005 2006 id only want to be holding shorts long term though
Ignored
well yea ,,no shit ,, aint much to get excited about everyone in the shitter ,, but the billions and billions sht making tht interest everyday ,, and getting payed to borrow the money to do it ,, think they want shit to change anytime soon lol
Joined Jan 2010
|
Status: The Voodoo Boodoo Club
|38,039 Posts
get a little geopolitical tension tho and look ,, gold takes off ,, currencys its the same ole lame ass stories ,,same ole news reports same this same tht ,, up a little down a little ,, moving up a bit now because the usd feds "might have to cut rates " the mkt will make them show it tho ,, but the change in trap flapping causes a little adjustment
Joined Jan 2010
|
Status: The Voodoo Boodoo Club
|38,039 Posts
oil dont get affected quite as much anymore because they let it get too high ,, now they just have better ways of extracting more ,, so oil not quite like it used to be
{quote} Lol,, i dont miss much man ,, to costly ,, then after a while ya just see its the same shit over and over ,, may shoot myself in the foor here and there but Im only human lol
{quote} Its different there hasn’t been small breakout like that on monthly in a while 2014 2005 2006 id only want to be holding shorts long term though
Ignored
there is never anything different ,, quieter now because of all the bullshit regulations after the big mkt crash ,, lots of stuff tht helped cause volatility is gone ,,, wild west days are over ,, soon as a gov pokes their nose in supposedly making it better for the little guy ah hell there goes the neighborhood , just makes it tougher for the little guy