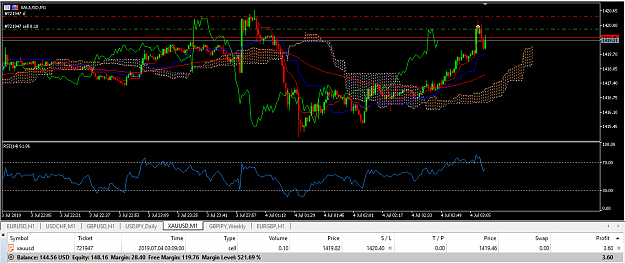
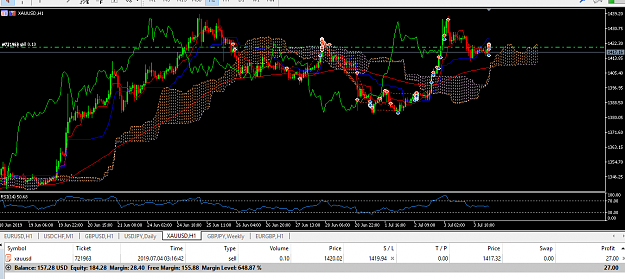
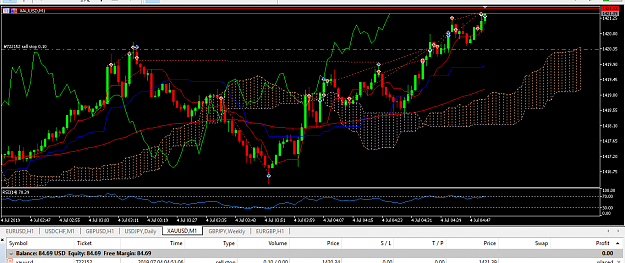
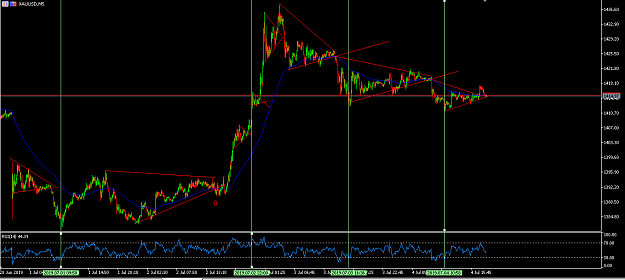
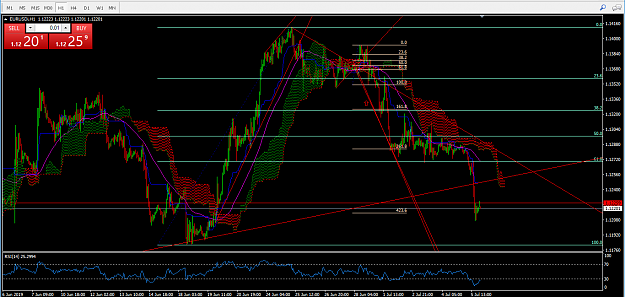
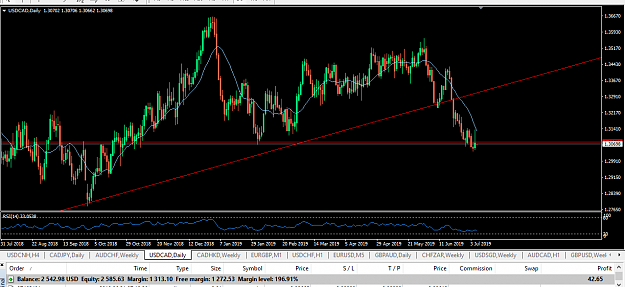
Trading the tip of the triangle. I want to know if this pattern is from fractals.
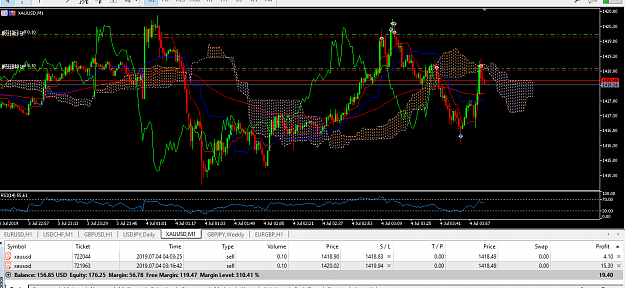
Bit of a false break where the arrow is.
Note the divergence on the RSI.
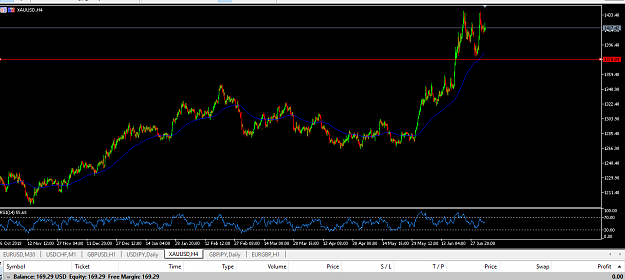
The trouble I have had in the past is not wanting to trade a bull flag or bear flag due to overbought or oversold conditions. I have been missing out on breakouts as a result. The RSI during the spike here stayed above 50 and reverted to 50 when the spike ended.
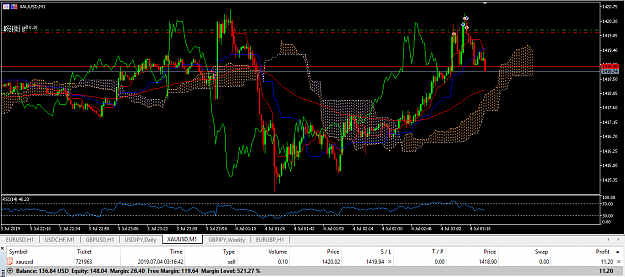
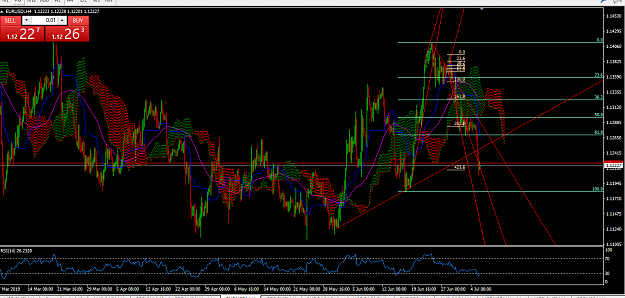
If I can tighten the stop timing these triangles right then breaks that go against bias can be traded. I had a short bias, but really there was still room upward (and perhaps still is).
Consolidation really gets tight before the break, as the triangles show.
The tips of these triangles are typically from price waiting until it hits a ma, like the 50.
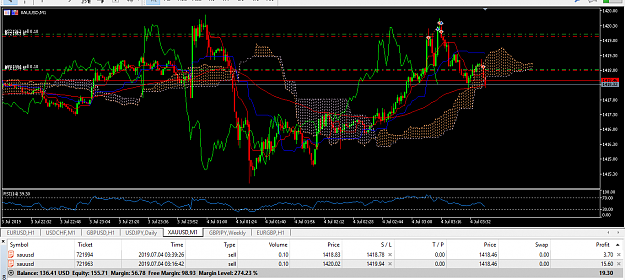
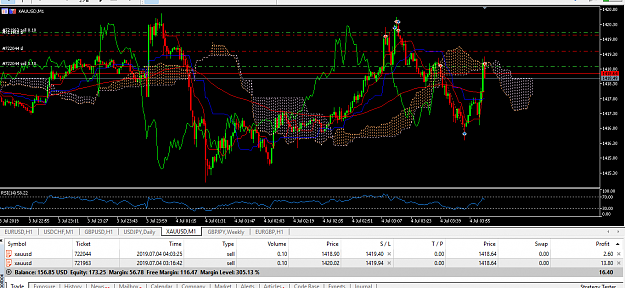
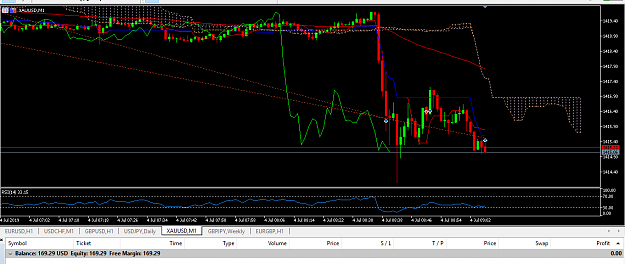
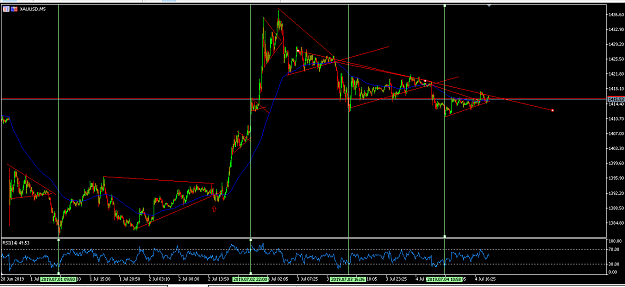
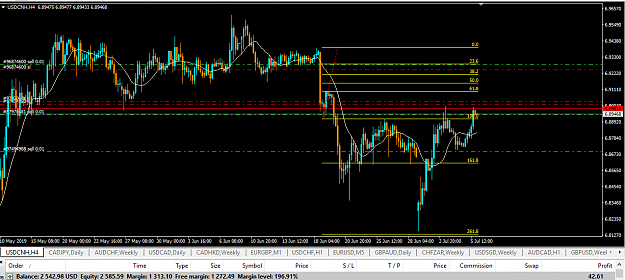
Overall a bullish break. It has tested previous resistance and bounced forming a new support. Likely a continuation. I took profit a little early because there was another spike down but it did retrace as I said. How to get in at this point. Longs?
Waiting for the spread to tighten then long with stop just below the last extension.
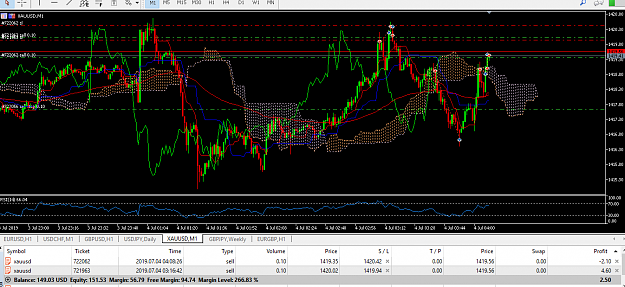
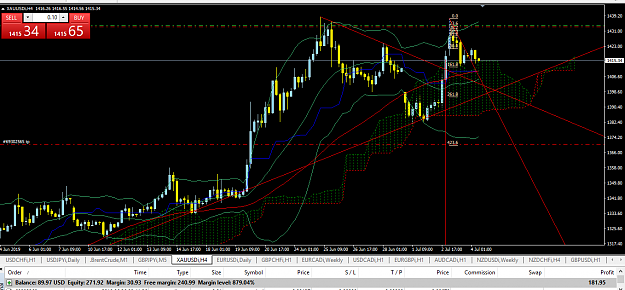
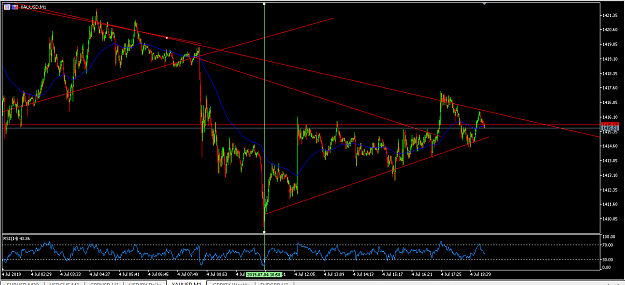
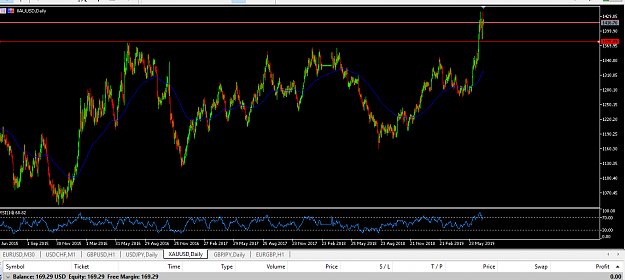
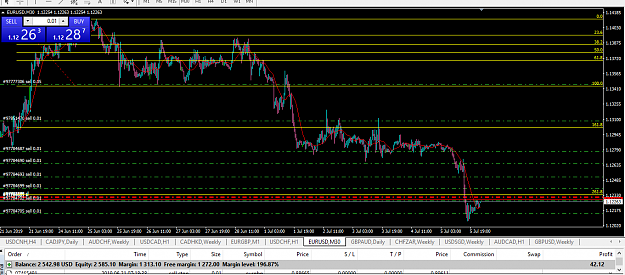
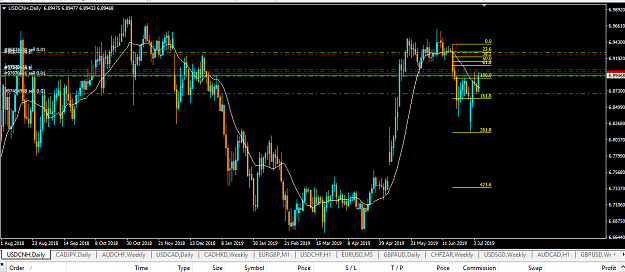
Since it broke support I am still looking for shorts but long for now until this fib level decides trajectory. Likely a retrace if there is a continuation, otherwise long from the monthly higher high.
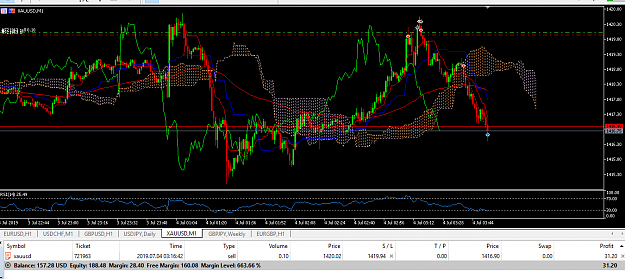
Moved stops up. Re-arranging and starting new accounts explains why account balance is lower. I transferred some money. I am going to mostly liquidate Oanda due to only 50:1 leverage compared to 1000:1.
This one I'm building. I may cut it short and switch it over to tradersway for better leverage. I'll wait until all the positions are in the money. Oanda is good still as a practice account for really small positions.
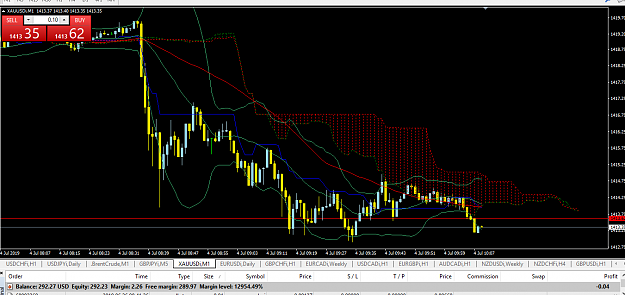
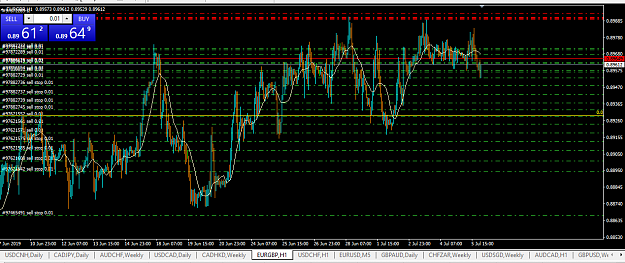
Honestly this consolidation gets me wary of another leg up. Perhaps switch for long soon. It is cupping down though.