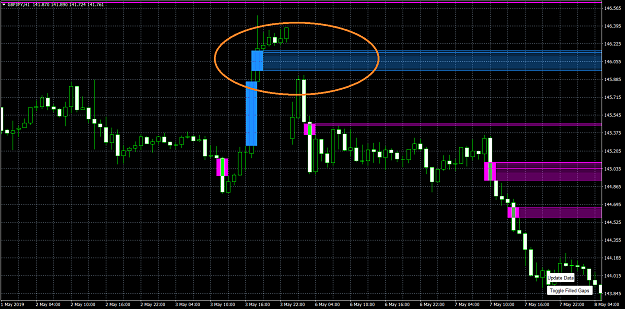
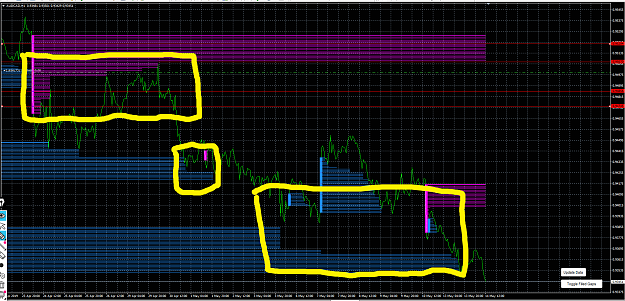
• Home
  • Forums
  • Trades
  • News
  • Calendar
  • Market
  • Brokers
  • Login
  • Join
  • User/Email: Password:
  • 10:49pm
Menu
  • Forums
  • Trades
  • News
  • Calendar
  • Market
  • Brokers
  • Login
  • Join
  • 10:49pm
Sister Sites
  • Metals Mine
  • Energy EXCH
  • Crypto Craft

Options

Bookmark Thread

First Page First Unread Last Page Last Post

Print Thread

Similar Threads

Money management: Capital needed per 0.07 USD per microlot 0 replies

The Volume Detective 411 replies

  • Recycle Bin
  • /
  • Reply to Thread
  • Subscribe
  • 2,396
Attachments: (binned per thread starter’s request) MM (Money Maker) Detective
Exit Attachments

(binned per thread starter’s request) MM (Money Maker) Detective

  • Last Post
  •  
  • 1 7475Page 767778 357
  • 1 Page 76 357
  •  
  • Post #1,501
  • Quote
  • May 13, 2019 6:51am May 13, 2019 6:51am
  •  robots4me
  • Joined Dec 2017 | Status: Member | 3,943 Posts
Quoting Blackeagle
Disliked
I have a question re. using liquidity gaps (LG) as targets. First chart below shows an LG on H4 (GBPUSD) between 08:00 and 16:00 bars on May 7th. The second chart shows two different LGs on H1 between the same time period as H4. Consider we are looking at charts at 16:00 on the same day and we have a long position. What would be our target in terms of LGs as different time frames show different targets? If someone checks M15, I am sure there will be different target levels of LGs. As entries are from M1, which time frame do we need to use to determine...
Ignored
@Blackeagle -- it's hard to read the numbers along the Y-axis on the RHS of your chart. I would think a liquidity gap is independent of the TF -- the price is the price regardless of the TF. The TFs receive the same tick data -- the only difference is how many ticks get condensed into each bar. If different TFs look different then that may be an artifact of how charts are displayed.

If you could choose one particular liquidity gap, zoom-in on M15, H1, H4 time frames, then I would expect to find the same gap in all 3. It might also be that what you think is a gap is not really a gap.
2
  • Post #1,502
  • Quote
  • May 13, 2019 7:08am May 13, 2019 7:08am
  •  Blackeagle
  • Joined Aug 2005 | Status: Member | 1,261 Posts
Quoting robots4me
Disliked
{quote} @Blackeagle -- it's hard to read the numbers along the Y-axis on the RHS of your chart. I would think a liquidity gap is independent of the TF -- the price is the price regardless of the TF. The TFs receive the same tick data -- the only difference is how many ticks get condensed into each bar. If different TFs look different then that may be an artifact of how charts are displayed. If you could choose one particular liquidity gap, zoom-in on M15, H1, H4 time frames, then I would expect to find the same gap in all 3. It might also be that...
Ignored
You don't need Y axis numbers. H4 liquidity gap consists of 3 bars, total of 12 hrs. Within that 12 hrs, there are 12 H1 bars and 48 M15 bars. Therefore, you cannot expect to find the same gap in all 3 time frames, I put those charts to show different time frames have different LGs.

Regards,
Blackeagle
  • Post #1,503
  • Quote
  • May 13, 2019 7:08am May 13, 2019 7:08am
  •  robots4me
  • Joined Dec 2017 | Status: Member | 3,943 Posts
Quoting mades
Disliked
{quote} My indis are far from standard ones, so I doubt I could use any dashboard with them. I would need to have a custom dashboard for those. Forex-station folks do produce every single indi as mtf/non-repainting. They are very seldom cpu intensive as I think they figured out a more efficient way of doing mtf. I really recommend you checking them - it belongs to Mladen, one of the most respected indi coders in the world and they will welcome your work and even improve on it if needed.
Ignored
@mades -- not to be rude, but please understand I'm not going to respond further to coding suggestions from someone who has never coded an indicator. The way @cja's dashboard switches between symbols and TF's is the same way as the MT4 application. They use the same APIs.

I'm familiar with mladen and forex-station -- great programmer and excellent site to find indicators. Coding a new indicator from scratch takes many hours. You don't go asking someone out of the blue to code a new indicator just for you. Clearly, you don't appreciate the amount of work that goes into one.

Quote
Disliked
My indis are far from standard ones, so I doubt I could use any dashboard with them. I would need to have a custom dashboard for those.
How do your indis differ from standard ones? Why do you doubt they would work with a dashboard? It would take, say, 30 seconds to try. Yet even though you don't understand how your indicators work, you would advise us?

I responded politely to your first post to give you a clue. I don't want to get sucked into responding to posts from people who are inexperienced programmers or non-programmers -- it becomes a never-ending merry go-round and a waste of time.
1
  • Post #1,504
  • Quote
  • May 13, 2019 7:31am May 13, 2019 7:31am
  •  robots4me
  • Joined Dec 2017 | Status: Member | 3,943 Posts
Quoting Blackeagle
Disliked
{quote} You don't need Y axis numbers. H4 liquidity gap consists of 3 bars, total of 12 hrs. Within that 12 hrs, there are 12 H1 bars and 48 M15 bars. Therefore, you cannot expect to find the same gap in all 3 time frames, I put those charts to show different time frames have different LGs. Regards, Blackeagle
Ignored
Quote
Disliked
which time frame do we need to use to determine targets by using LGs

This is a good question -- and my authoritative answer is -- I don't know...

At higher TFs the bar resolution is lower -- i.e. more ticks are condensed into each bar. So, there may be liquidity gaps visible at lower TFs that are not visible at higher TFs.

@moodybot recommended H1 -- so, that is probably a good place to start.


Quote
Disliked
I put those charts to show different time frames have different LGs.

Now that you bring it up -- yes, that is what I would expect. However, if a liquidity gap was detectable at a higher TF then I would expect it to also be detectable at a lower TF, but not the other way around.
  • Post #1,505
  • Quote
  • May 13, 2019 9:18am May 13, 2019 9:18am
  •  behof
  • | Joined Feb 2006 | Status: Member | 410 Posts
Hi folks !

I have attached an article regarding the subdecimal trading in FX.
It refers to the high influence of High frequency trading and the advantages
using this subdecimals.
Maybe George can comment.
Because he referred to 0 gaps and how powerful they can be.
Attached File
File Type: pdf Tick Size.pdf   2.2 MB | 335 downloads
  • Post #1,506
  • Quote
  • Edited at 1:49pm May 13, 2019 1:39pm | Edited at 1:49pm
  •  robots4me
  • Joined Dec 2017 | Status: Member | 3,943 Posts
Quoting behof
Disliked
Hi folks ! I have attached an article regarding the subdecimal trading in FX. It refers to the high influence of High frequency trading and the advantages using this subdecimals. Maybe George can comment. Because he referred to 0 gaps and how powerful they can be. {image}
Ignored
@behof -- a bit off-topic. I don't think anyone is going to spend time slogging through a 40-page research paper. How about putting yourself in the other person's shoes and briefly summarize for us the main points. And then, if someone thinks it sounds interesting, they can dig deeper.

Posting a link to a document like this and asking @George to spend many hours reading it and then summarizing it for you isn't fair. Besides -- this request is probably best handled by sending him a PM.
2
  • Post #1,507
  • Quote
  • May 13, 2019 3:55pm May 13, 2019 3:55pm
  •  behof
  • | Joined Feb 2006 | Status: Member | 410 Posts
Hi robots4me !

Accepted

Cheers
1
  • Post #1,508
  • Quote
  • May 14, 2019 2:20am May 14, 2019 2:20am
  •  robots4me
  • Joined Dec 2017 | Status: Member | 3,943 Posts
I've uploaded the initial version of the MMLiquidityGaps indicator I've mentioned a few times in recent posts. You can find it toward the end of post #1, which I've had to reorganize. I'm currently working on a *.pdf to provide some minimal documentation.

If you are interested in liquidity gaps as we've been discussing recently, then I think this is a pretty cool indicator. It goes further than others that have been posted in that (a) you can see the gaps gets filled -- piece-by-piece or all at once, (b) you can choose to show / hide gaps as they get filled.

Please keep in mind this is a one-man operation operating out of the trunk of his car -- I am developer, tester, data analyzer, hypothesizer, OP, etc -- all rolled into one. Please don't ask me the best settings or ways to trade with this indicator -- most of you know more than me. I would greatly value feedback and comments --and for those who are interested I do have a request -- please focus on correctness. There is no official specification for what constitutes a liquidity gap and how to detect it. I'm only one set of eyes -- and the most valuable thing at this point would be to reach a consensus that the indicator works as expected -- and if it doesn't then I'll make corrections. Additional features can come later. Also, please don't send links to other examples of liquidity gap detection algorithms unless you understand how they work and have confirmed they are superior to how MMLiquidityGaps is working. Overwhelming me with other examples doesn't help.

Performance (i.e. CPU hog) may be an issue -- so I've implemented a couple of ways to address this, which I will describe in the documentation I mentioned above.

I think that's all for now -- thanks...
14
  • Post #1,509
  • Quote
  • May 14, 2019 2:39am May 14, 2019 2:39am
  •  Sky77
  • Joined May 2014 | Status: Closed on request | 4,721 Posts
Quoting robots4me
Disliked
I've uploaded the initial version of the MMLiquidityGaps indicator
Ignored
If you can make that Update /toggle boxes movable on chart or insert option x/y values in set panel will be nice. I guess with time and new improvements load on cpu can be improved.
thx for indi
cheer up!
Take what you can, give nothing back
1
  • Post #1,510
  • Quote
  • May 14, 2019 4:16am May 14, 2019 4:16am
  •  aaven
  • Joined Jul 2015 | Status: Member | 2,270 Posts
Quoting robots4me
Disliked
I've uploaded the initial version of the MMLiquidityGaps indicator I've mentioned a few times in recent posts. You can find it toward the end of post #1, which I've had to reorganize. I'm currently working on a *.pdf to provide some minimal documentation. If you are interested in liquidity gaps as we've been discussing recently, then I think this is a pretty cool indicator. It goes further than others that have been posted in that (a) you can see the gaps gets filled -- piece-by-piece or all at once, (b) you can choose to show / hide gaps as they...
Ignored
Thank You Steve for staying on top and sharing your hard work and time generously to the community...
4
  • Post #1,511
  • Quote
  • May 14, 2019 4:32am May 14, 2019 4:32am
  •  aaven
  • Joined Jul 2015 | Status: Member | 2,270 Posts
Quoting robots4me
Disliked
I've uploaded the initial version of the MMLiquidityGaps indicator I've mentioned a few times in recent posts. You can find it toward the end of post #1, which I've had to reorganize. I'm currently working on a *.pdf to provide some minimal documentation. If you are interested in liquidity gaps as we've been discussing recently, then I think this is a pretty cool indicator. It goes further than others that have been posted in that (a) you can see the gaps gets filled -- piece-by-piece or all at once, (b) you can choose to show / hide gaps as they...
Ignored
Steve,

This may/may not be a possible error based on my understanding. In the snapshot, there was a gap down over the bullish liquidity gap. Shouldn't that be considered as filling the liquidity gap? {I am also not sure} and so hence the lines shouldn't be displaying? I have used toggle button to not show liquidity gaps that have been filled.

Attached Image (click to enlarge)
Click to Enlarge

Name: GBPJPYH1.png
Size: 47 KB


Thanks
1
  • Post #1,512
  • Quote
  • May 14, 2019 5:08am May 14, 2019 5:08am
  •  handy148
  • Joined Oct 2010 | Status: Member | 2,351 Posts
Yes it doesn't look quite right to me but I'll wait for the pdf.
  • Post #1,513
  • Quote
  • May 14, 2019 5:08am May 14, 2019 5:08am
  •  iwjw
  • | Joined Mar 2011 | Status: Member | 464 Posts
Quoting robots4me
Disliked
I've uploaded the initial version of the MMLiquidityGaps indicator I've mentioned a few times in recent posts. You can find it toward the end of post #1, which I've had to reorganize. I'm currently working on a *.pdf to provide some minimal documentation. If you are interested in liquidity gaps as we've been discussing recently, then I think this is a pretty cool indicator. It goes further than others that have been posted in that (a) you can see the gaps gets filled -- piece-by-piece or all at once, (b) you can choose to show / hide gaps as they...
Ignored
Hi,
thanks for your work and sharing the indicator
Could you please make sure, that on deinit() and Update Data only those objects are deleted that were created by your indicator
Looks like you are using ObjectsDeleteAll()
Thanks in advance
  • Post #1,514
  • Quote
  • May 14, 2019 5:20am May 14, 2019 5:20am
  •  robots4me
  • Joined Dec 2017 | Status: Member | 3,943 Posts
Quoting aaven
Disliked
{quote} Steve, This may/may not be a possible error based on my understanding. In the snapshot, there was a gap down over the bullish liquidity gap. Shouldn't that be considered as filling the liquidity gap? {I am also not sure} and so hence the lines shouldn't be displaying? I have used toggle button to not show liquidity gaps that have been filled. {image} Thanks
Ignored
@aaven -- thanks.

I think that would be considered a price gap -- it occurred over the weekend.

The indicator, as currently written, should NOT treat that as a liquidity (or hidden) gap. Since that is a real gap then the price never existed within that range. Hence, unfilled orders could not be filled.

My "hypothesis" is that a liquidity gap reflects unfilled orders that are waiting for sufficient currency units at a particular price (i.e. sufficient liquidity) in order to be transacted. This is different than a price gap, which may reflect a true drop in value due to events that occurred over the weekend.

Liquidity gaps need to be filled -- hence, the MM will need to move prices into the gap's range. Price gaps do not be to be filled because there are no outstanding orders that need to be transacted.

You'll notice that when price moves into the range of a liquidity gap, thereby allowing pent-up orders to be released, the price then moves (perhaps just briefly) in the direction you'd expect.
2
  • Post #1,515
  • Quote
  • May 14, 2019 5:28am May 14, 2019 5:28am
  •  robots4me
  • Joined Dec 2017 | Status: Member | 3,943 Posts
Quoting iwjw
Disliked
{quote} Hi, thanks for your work and sharing the indicator Could you please make sure, that on deinit() and Update Data only those objects are deleted that were created by your indicator Looks like you are using ObjectsDeleteAll() Thanks in advance
Ignored
@iwjw -- ObjectsDeleteAll() has nothing to do with this. That is an API that gets called when the indicator is deinit'd and exits.

What @aaven circled is a price gap that occurred over a weekend -- possibly caused by some event that actually caused a devaluation in GBP. Regardless of what might have caused it, that space means the price never existed within that range. Since the price never existed in that range then any pent-up, unfilled orders that were waiting for a price within that range would remain unfilled.

Remember -- a price gap gets filled when the MM pushes the price back within its range. If the price skips over the range (as it did with this price gap) then the gap remains unfilled. At least that is my working hypothesis.
1
  • Post #1,516
  • Quote
  • May 14, 2019 5:38am May 14, 2019 5:38am
  •  robots4me
  • Joined Dec 2017 | Status: Member | 3,943 Posts
Quoting aaven
Disliked
{quote} Steve, This may/may not be a possible error based on my understanding. In the snapshot, there was a gap down over the bullish liquidity gap. Shouldn't that be considered as filling the liquidity gap? {I am also not sure} and so hence the lines shouldn't be displaying? I have used toggle button to not show liquidity gaps that have been filled. {image} Thanks
Ignored
@aaven, @iwjw -- another thing to notice.

In the case of a Bullish liquidity gap, the MM needs to push the price downward to begin filling the liquidity gap. As pent-up, unfilled BUY orders get transacted what do you think happens to the price? It moves back up. I've seen that many times now.

In the case of a Bearish liquidity gap, the MM needs to push the price upward to begin filling the liquidity gap. As pent-up, unfilled SELL orders get transacted then the price moves back down.

In the case that @aaven circled, that's a Bullish liquidity gap. The price didn't get pushed downward into the gap's range -- it skipped over it.
1
  • Post #1,517
  • Quote
  • May 14, 2019 5:57am May 14, 2019 5:57am
  •  rosalieone
  • Joined Sep 2009 | Status: Member | 439 Posts | Online Now
Quoting robots4me
Disliked
{quote} @aaven, @iwjw -- another thing to notice. In the case of a Bullish liquidity gap, the MM needs to push the price downward to begin filling the liquidity gap. As pent-up, unfilled BUY orders get transacted what do you think happens to the price? It moves back up. I've seen that many times now. In the case of a Bearish liquidity gap, the MM needs to push the price upward to begin filling the liquidity gap. As pent-up, unfilled SELL orders get transacted then the price moves back down. In the case that @aaven circled, that's a Bullish liquidity...
Ignored
Hi Robots4me,
Thanks for your magnificent tool, we enter a new dimension !
After watching the filing of the LG by candles with wicks and the same by line chart (only close without wicks) it seems we can have a slightly different interpretation and explain the future move. If we consider the LG filled by wicks there is not so much ''meat'' left in the LG. If you consider only the close thats a different story (just an example hereunder)
Would it be difficult for you to add the ''with or without wick'' option when filling the LG ?
I'm not saying that wicks are not usefull (we have seen wicks reaching a target by the pip) but in case of a LG it seems adding confusion (for me)
Attached Image (click to enlarge)
Click to Enlarge

Name: CloseOnly.png
Size: 92 KB
3
  • View Post
  • Disliked by Thread Starter
  • RyanGriffith
  • Post #1,519
  • Quote
  • May 14, 2019 8:05am May 14, 2019 8:05am
  •  robots4me
  • Joined Dec 2017 | Status: Member | 3,943 Posts
Quoting rosalieone
Disliked
{quote} Hi Robots4me, Thanks for your magnificent tool, we enter a new dimension ! After watching the filing of the LG by candles with wicks and the same by line chart (only close without wicks) it seems we can have a slightly different interpretation and explain the future move. If we consider the LG filled by wicks there is not so much ''meat'' left in the LG. If you consider only the close thats a different story (just an example hereunder) Would it be difficult for you to add the ''with or without wick'' option when filling the LG ? I'm not...
Ignored
Hello @rosalieone -- yes, it would be possible, but I'm not sure that I understand.

Using the line chart then it is easier to see how the price pulls back after it has eaten into the LG. That pull back is due to unfilled orders that have now been released.

Currently the wicks (i.e. the Highs and Lows) are mostly responsible for pushing into the LG's range. If there were a "without" wick option that would mean only candle bodies would eat into the LG's range. That would prolong the lifetime of LGs and require the MM to push further into the LG's range to finish filling the gap. Is that what you mean?

If the purpose of filling the LG is to create liquidity to release unfilled orders, then wicks should count. If wicks should not count (but only candle bodies), then what would be your explanation for the MM wanting to fill a LG?
2
  • Post #1,520
  • Quote
  • May 14, 2019 8:27am May 14, 2019 8:27am
  •  rosalieone
  • Joined Sep 2009 | Status: Member | 439 Posts | Online Now
Quoting robots4me
Disliked
{quote} Hello @rosalieone -- yes, it would be possible, but I'm not sure that I understand. Using the line chart then it is easier to see how the price pulls back after it has eaten into the LG. That pull back is due to unfilled orders that have now been released. Currently the wicks (i.e. the Highs and Lows) are mostly responsible for pushing into the LG's range. If there were a "without" wick option that would mean only candle bodies would eat into the LG's range. That would prolong the lifetime of LGs and require the MM to push further into the...
Ignored
I'm sorry for my fuzzy explanations but if you look a little bit closer you see that they go allover like sharks after the meat (LG body) and it seems thats the reason for many moves. Look at the following picture.
Attached Image (click to enlarge)
Click to Enlarge

Name: AfterTheMeat.png
Size: 70 KB

Point 1. If we use the wicks the LG stops here, but with only the close the LG should continue to point 2. (reason for the next moves to finish the meat)
Point 3. With the wicks LG meat stops here, but with the close line it should in fact continue to point 5 (first bite point 4. and finishing bite point 5.)
Point 5. over it, there is a new LG meat which is eaten with 2 bites, and if we use wicks the meat stops over point 5 but if we use close line we see it should in fact continue a little (if you zoom in you can see a small horizontal line not eaten reason for the next little top to finish the plate)
Point 8. the reason for the moves here is to finish the meat left in point 7 which should be much more fat if we hadnt considered the stop at the wicks (point 7)
I think i'm on something and i will have a look at other examples.
2
  • Recycle Bin
  • /
  • (binned per thread starter’s request) MM (Money Maker) Detective
  • Reply to Thread
    • 1 7475Page 767778 357
    • 1 Page 76 357
0 traders viewing now
  • More
Top of Page
  • Facebook
  • Twitter
About FF
  • Mission
  • Products
  • User Guide
  • Media Kit
  • Blog
  • Contact
FF Products
  • Forums
  • Trades
  • Calendar
  • News
  • Market
  • Brokers
  • Trade Explorer
FF Website
  • Homepage
  • Search
  • Members
  • Report a Bug
Follow FF
  • Facebook
  • Twitter

FF Sister Sites:

  • Metals Mine
  • Energy EXCH
  • Crypto Craft

Forex Factory® is a brand of Fair Economy, Inc.

Terms of Service / ©2021