{quote} @Robot Trader -- yes... And what @Nih98 suggested above, that is easier said than done. He explained that analyzing one chart is "only a small part of the global financial orchestration". So, ranking target levels based on one pair may not be the right way to think about it -- too simplistic. Though I would like to discover / uncover some additional logic -- I'm guessing we may be missing too many pieces. So it may not be something discoverable by intellectualizing about it. If we were to discover something, it would probably come from some...
Ignored
Check the recent event, NZD rates cut 0.25 basis point
Check the whole NZD pairs if you have including ZAR, TRY, etc if you have. Then you can see that MM make adjustment to the whole pairs in that 'second' where from macro economics point of view, there's still nothing should change at that 'second' point. the rates cut just announced, the real economic impact will gradually happen days or weeks after that. but look at that 'prices'..
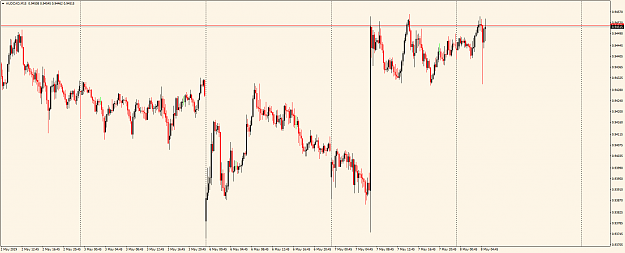
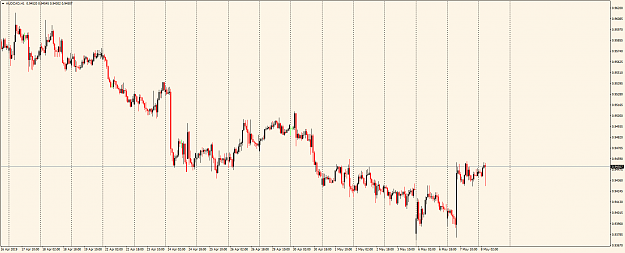
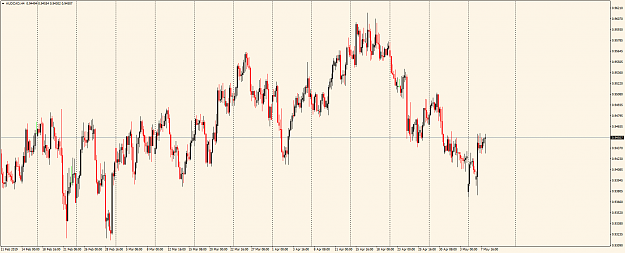
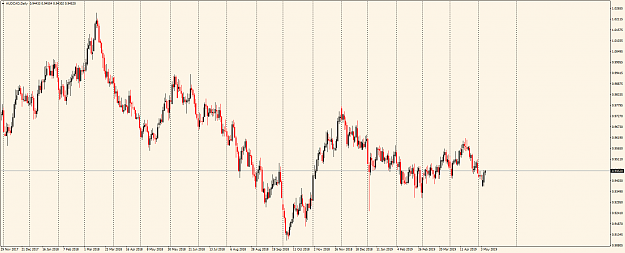
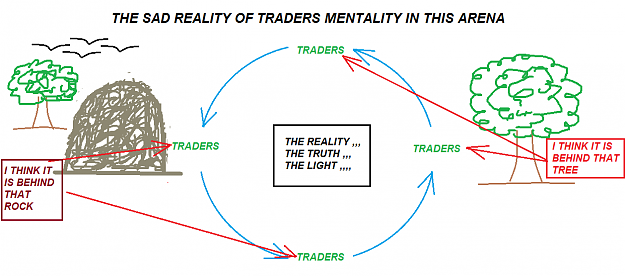
Here we have four groups of monkey, all trying to work out the trend. Which group is correct? {image} {image} {image} {image}
Ignored
The Daily shows the Trend, which ended Mid October and since the beginning of November it is now ranging. Not sure why you are using smaller TF's to determine a Trend. All they do is give you targets within this new ranging market until we have another event which will kick start a new Trend
Some people say I'm lucky, but the more I practice the luckier I get
{quote} The Daily shows the Trend, which ended Mid October and since the beginning of November it is now ranging. Not sure why you are using smaller TF's to determine a Trend. All they do is give you targets within this new ranging market until we have another event which will kick start a new Trend
Ignored
Robot trader...
On this thread, an indicator, charts with spaghetti, trend lines(?), Murray Math's....every man and his dog has an input.....
Which way is the trend going..... up, down, sideways.....???
This is a great pic... explains trends perfectly....
How about the trend...connect two tops...which two tops...in hindsight as always....
Which way is the trend running (obviously no trend), H4 chart over multiple weeks, is the market about a trend or the institutional herd mentality validations..(psychology at the highest order)...
{quote} Robot To take part in this game we need the MM to convey a message in a way that, we as humans, can interpret. The easiest solution is to use our eyes, so they provide a chart. Confusion 1. They require us to take a view as to which direction they want us to place our money. Confusion 2. They arrange this through the medium of numbers...called price. Confusion 3. To demonstrate price on a chart they show open,high,low and close... Confusion 4. And so on.... We as traders see the numbers interpreted into candles and draw lines up and down...
Ignored
Quote
Disliked
We as traders see the numbers interpreted into candles and draw lines up and down (trend lines) in the hope they will provide a glimpse into the future. Not in my book.
A comment and then a question...
Your message is that it's all a mirage -- price, OHLC bars, support, resistance, etc. All to lure traders (retail, commercial, institutional) into the MM's web. Okay, I can contemplate that. But then, why is it, when we ask for further details we are told to go off and study charts for thousands of hours? On one hand you enlighten us by pointing out it's all a mirage. But the next moment, when someone says "okay, how do I move past this?", the response is to go study the mirage some more. I don't get that. This could lead to another interesting discussion, but out of respect for @George I wouldn't want to do it without him present to share his point of view. Or, @moodybot, if it is okay with @George, I'm game to discuss it with you -- in a subsequent post.
Okay -- I buy into all the MM psychology and "it's all a mirage" thing. Now what? Why should I care? You've shown me how the MM exposes it's hand after a spike and re-entry into your TMA. Perhaps the MM shows it's hand in other ways, but let's take this one as an example. Why should I spend time trying to understand all the manipulation that went on prior to the MM showing its hand? All I want to do is trade and make a few pips. Using @SwingMan's Level-3 fractal indicator then signals become obvious -- and I may even throw in a TMA envelope for good measure. So, why the big deal about MM psychology when all I really need is a signal for when to enter a trade?
{quote} Good observation. Will you get a straight in the face direct answer that everybody understands ? NO. That's after hundreds of pages on 2 threads.
Ignored
What are you talking about. Post's from George show exactly how and where to identify the areas of interest. Exactly. Its a straight answer.
{quote} Hiya Robots.... You can thank me later....But I have found the solution you have been searching so hard for.... You know what they say a picture is worth a thousand words.... Hope this helps $14.49 Canadian Cheers Blue {image}
Ignored
@bluesteele -- you have no idea how appropriate that is. Most people won't get it. I had the original one -- it's still probably somewhere in a box in the attic. And, you know, I bet it would be a better trader than me.
{quote} {quote} A comment and then a question... Your message is that it's all a mirage -- price, OHLC bars, support, resistance, etc. All to lure traders (retail, commercial, institutional) into the MM's web. Okay, I can contemplate that. But then, why is it, when we ask for further details we are told to go off and study charts for thousands of hours? On one hand you enlighten us by pointing out it's all a mirage. But the next moment, when someone says "okay, how do I move past this?", the response is to go study the mirage some more. I don't...
Ignored
R4Me
I'm sure a while ago i posted a few charts that shows absolutely, without misinterpretation, Georges view on how to find an area to trade too, or from.
Nothing has changed, nothing has changed in years...
You want to trade, I get that, George has offered you insight into a very well thought out highly provable method.
In my view you have two options, improve on Georges ideas and methods, or play chase the tail, go round in circles and follow monkeys through the trees.
You are a scientist.... after 10 years in Forex I can say this to you .........
Occams Razor.... George has the simplest solution when compared to anyone else's.......
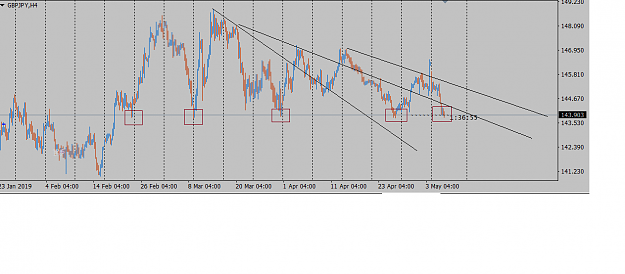
{quote} Robot trader... On this thread, an indicator, charts with spaghetti, trend lines(?), Murray Math's....every man and his dog has an input..... Which way is the trend going..... up, down, sideways.....??? This is a great pic... explains trends perfectly.... How about the trend...connect two tops...which two tops...in hindsight as always.... Which way is the trend running (obviously no trend), H4 chart over multiple weeks, is the market about a trend or the institutional herd mentality validations..(psychology at the highest order)... {image}...
Ignored
Trading is about following PA and not to be just a Bull or Bear when you look at the charts, the Sharks make most of their money following an event (which will become a Short or Long term Trend)
But the Sharks have the advantage of taking out SL's, so most of their positions are FREE because they are using our money to gain more money.
I am interacting with this thread because of the MM Detective Indicator, I am not really interested if it can or cannot be used based on George's strategy I just want to see if it can be used with a degree of success.
As traders our main purpose is to make money, I do that through the EA's that I have developed which work in all market conditions and do not need optimizing, so I am always looking for a new idea that is worth developing into an EA.
Some people say I'm lucky, but the more I practice the luckier I get
{quote} Trading is about following PA and not to be just a Bull or Bear when you look at the charts, the Sharks make most of their money following an event (which will become a Short or Long term Trend) But the Sharks have the advantage of taking out SL's, so most of their positions are FREE because they are using our money to gain more money. I am interacting with this thread because of the MM Detective Indicator, I am not really interested if it can or cannot be used based on George's strategy I just want to see if it can be used with a degree...
Parisboy's signature is the truth. The universe is vibration.
Each time frame and each currency has it's vibration. Then there are cycles (yearly, quarterly, monthly, weekly, daily, etc.), sometimes the time frames line up, other times they do not.
Each time frame has it's own trend. Because 4 different time frames have different trends does not mean that there are no trends. Shouldn't take 40,000 hours to see that.
Parisboy's signature is the truth. The universe is vibration. Each time frame and each currency has it's vibration. Then there are cycles (yearly, quarterly, monthly, weekly, daily, etc.), sometimes the time frames line up, other times they do not. Each time frame has it's own trend. Because 4 different time frames have different trends does not mean that there are no trends. Shouldn't take 40,000 hours to see that.
Ignored
There is no trend.
There never was a trend.
The time frames do show all the information that you require to trade.
The charts show with absolute integrity exactly where the MM wants each and every trader, retail or institutional, to place their stops.
They move the market in a way to entice traders to move stops based on BS support and resistance. That's it.
I know you don't want to drop trends etc, they work some of the time, fibs work some of the time, if they are accurate enough for you, that's great.
Taking a leaf out of Georges book, they are not accurate enough for me.
George could demonstrate to you, leaving you in no doubt, that trends do not exist but best leave it there.
Cheers......
Been looking at historic gaps on higher level charts where price opens beyond where it closed. These are very powerful target levels and I believe are lines that should not be deleted as we determine levels.
These lines when continued appear to often form the bottom of herd validation zones.
Been looking at historic gaps on higher level charts where price opens beyond where it closed. These are very powerful target levels and I believe are lines that should not be deleted as we determine levels. These lines when continued appear to often form the bottom of herd validation zones. R4me is a gap indicator feasible? Ray
Ignored
Now we are talking Turkey
Some people say I'm lucky, but the more I practice the luckier I get
Been looking at historic gaps on higher level charts where price opens beyond where it closed. These are very powerful target levels and I believe are lines that should not be deleted as we determine levels. These lines when continued appear to often form the bottom of herd validation zones. R4me is a gap indicator feasible? Ray
Been looking at historic gaps on higher level charts where price opens beyond where it closed. These are very powerful target levels and I believe are lines that should not be deleted as we determine levels. These lines when continued appear to often form the bottom of herd validation zones. R4me is a gap indicator feasible? Ray
Ignored
@TopCover -- interesting you should bring up gaps...
A gap indicator is feasible -- however I'm not the guy to provide the necessary details as to what to look for. I mean I could add code to detect gaps, but I'm not sure what it means.
@TopCover -- you've been very good about sharing charts with excellent descriptions. Would you mind sharing another example. I know what a gap is and I've seen them, but I don't get the significance. Why are they a powerful target?
At the expense of going off topic, I thought I'd share an anomaly in how MT4 handles closing prices that not many people are aware of -- not sure if this would be related to gaps or not, though.
Your broker streams data to your MT4 application in the form of OHLC prices (Open / High / Low / Close). These are called ticks. Ticks arrive at various times depending on the symbol. In the case of a popular symbol like EURUSD, there could by several ticks per second. In the case of more exotic pairs the ticks arrive less frequently. Ticks are the raw data -- the only data. Candles, bars, lines are not real data -- they represent a compressed form of the tick data and, hence, are a type of indicator.
So, why would MT4 compress the data? Why don't we just trade the raw tick data? Think about it. Let's say we have a EURUSD chart open and ticks arrive at 10 ticks / second. And let's say my screen resolution is 1280x1024. That means the most I can see is 128 seconds worth of data at a time -- just barely more than 2 minutes. Not so helpful. So the concept of candle and bar charts was introduced so we could see a bigger picture of the data. If each bar represents many ticks, then by using bars we get a better overall picture.
Taking EURUSD as an example -- each time frame gets all the same ticks. It makes no difference -- they all get the same ticks. In the case of H1, MT4 collects all the tick data received during the hour and displays it as a single bar. In the case of M15, MT4 collects all the tick data received during a 15-minute interval and displays it as a single bar.
The wicks of each candle (i.e. the High and Low) are the highest and lowest price for that candle. If you are monitoring a candle in real-time then the High and Low is constantly changing as new tick data arrives. Once a time frame ends, then the candle's OHLC prices are frozen and never change.
While the current candle is forming the High and Low may also change as new tick data arrives. Also, the Close changes, as well. That is, while a candle is currently under formation there is no Close -- instead, the Close of the current candle is actually the Ask price. What this means is there is no such thing as a close price until the next candle begins.
With regards to the Open price -- MT4 guarantees you will receive a tick at the beginning of each time frame. This is the Open price. Even though your broker may not have received a new tick from its data provider -- your broker will send the most recent price (as a tick) at the exact beginning of a time frame.
And what about the close price? You would expect MT4 to send a tick at the end of each time frame. But it doesn't. Turns out the closing price is the last tick received before a new candle. What this means is you won't know the closing price until the next candle begins. If ticks are arriving fast and furious then the last tick before the beginning of a new candle might arrive a few moments before the Open tick. But, depending on the pair or time of day, the last tick could be seconds or minutes before the Open tick. In other words, there could be a significant gap in time between the Open of the current bar and the Close of the previous bar. This may or may not create a price gap, as @TopCover has noted.
A couple of paragraphs ago I lied about all time frames receiving the exact same ticks -- that is not exactly true. Every time frame receives the same tick data that your broker receives from its data provider. The only difference is the Open tick. MT4 guarantees an Open tick at the beginning of a time frame, regardless whether it is a true tick or not (probably not a true tick). So, M15 receives a "virtual" open tick at every 15 minute interval. H1 does not receive M15 virtual open ticks -- but it does receive H1 open virtual ticks.
No time frame receives a close tick. Rather, the close tick is determined after the fact -- i.e. only after the next open tick is received. It is the last tick received for that particular time interval, whenever that was.
Most of us think the close of the previous bar is the same as the open of the new bar -- but that is not necessarily the case. I'm not sure whether this is part of the MM manipulation or not -- I just wanted to take this opportunity to point it out.