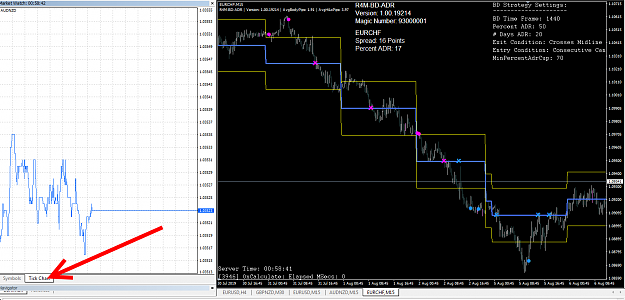
Disliked{quote} Hi R4ME, Thank you for responding, Sorry I didn't mean to cause you any inconvenience. Those yellow and white bands are actually key support/ resistance or pivot levels. The thick blue line across the chart is the 50 day SMA for trend detection. The arrows are plotted from the 3 and 2 MA periods and signals . are generated from the cross over. Text on the chart background for entry and take profit level are derived from the indy called Murray Math. The name Dynamic gains reflects the ability of the indi to detect liquidity sentiment shift...Ignored
QuoteDislikedThe takeaway for me is the precise and accurate signals it generates.