Intro:
- It’s pretty straight-forward system as I like to keep it simple.
- Use proper risk:reward / money management when trading and don’t over leverage yourself.
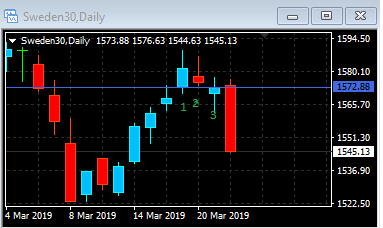
- I always look at the bigger picture from 4hr/Daily/Weekly/Monthly Charts before making any decisions to trade.
- I trade 28 Pairs, on the 4hr to Daily Charts. This is just my preference which suits my schedule.(But this system works on lower timeframes as well. Just adjust your takeprofit / stoploss accordingly)
- Trading market hours (24hrs). I don’t limit myself to certain market hours.
- I don’t use an EA or any indicators. You are more than welcomed to put this into an EA to test for yourself.
Note:
- Please don’t ask me about trade results, win/loss ratios, etc... Because not everyone is going to trade the exact same system with the same results. Do your due dilligence, and test it out for yourself.
System:
- Open Price
- Engulfing Bars
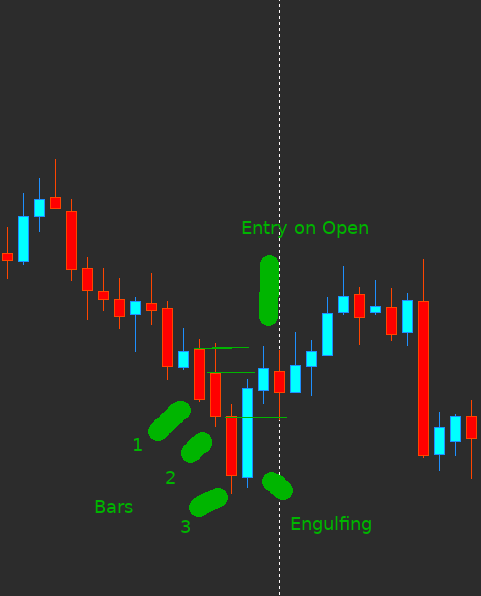
The general idea is to look for Engulfing Bars above or below the Open Price Pivot. Above the open price look for buys, Below the open price look for sells.
Open Price (Pivot)
- I use this similar to a pivot point.
- The Open Price is dynamic and moves based on the outcome of the current candles high/low/ and close.
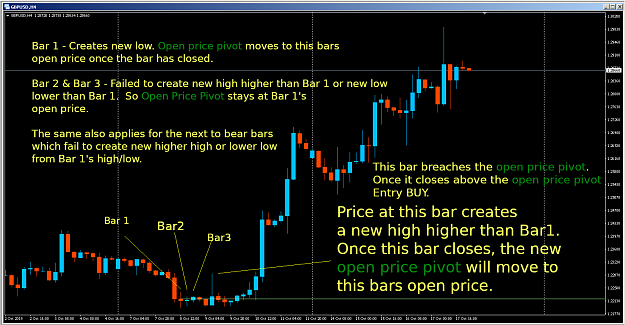
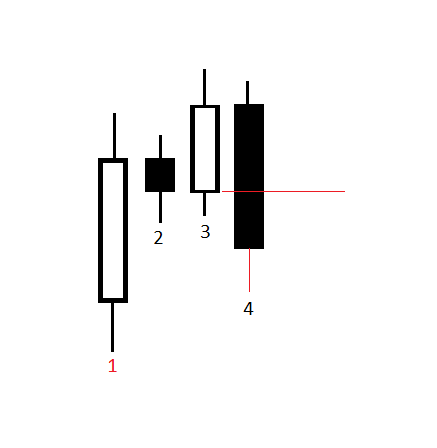
- If the current candle (let’s call it Bar2) makes a higher high or lower low than previous candle (let’s call it Bar1), then once the Bar2 closes, the Pivot gets moved to the “Open Price” of Bar2.
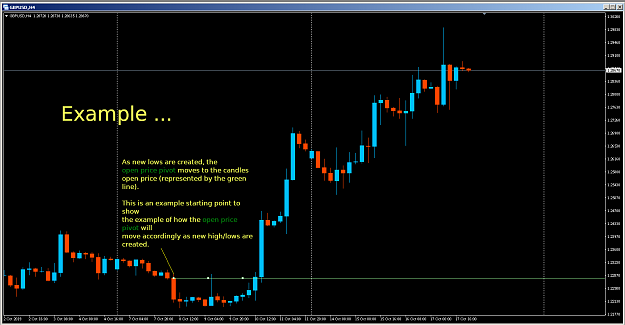
Example as candles move up

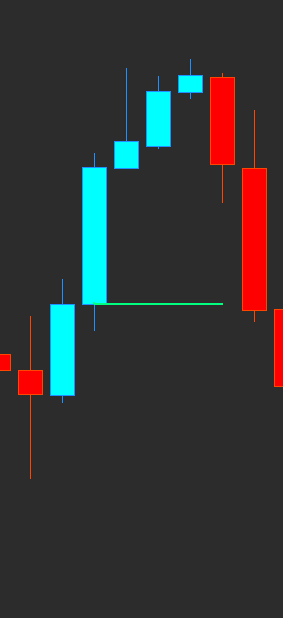
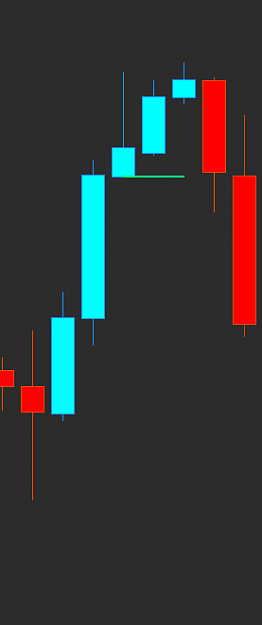
So for this example, let’s say our Open Price begins on Bar1.
Bar2 makes a higher high, once Bar2 closes, the Open Price Pivot moves to Bar2’s Open.
Bar3 makes a higher high, once Bar3 closes, the Open Price Pivot moves to Bar3’s Open.
Bar4 doesn’t make a higher high, the Open Price Pivot stays at Bar3.
Bar5 makes a higher high over Bar3, once Bar5 closes, the Open Price Pivot moves to Bar5.
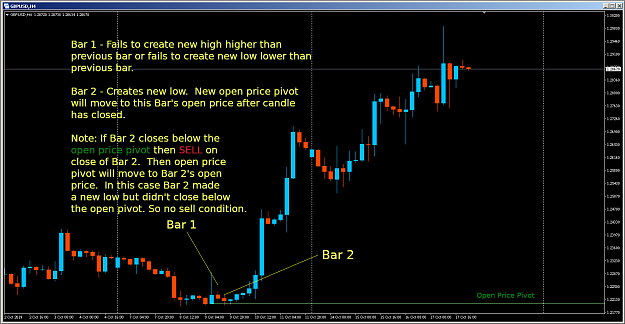
This is the same process of moving the Open Price Pivot when price is moving down as each candle is making lower lows compared to the previous candle.
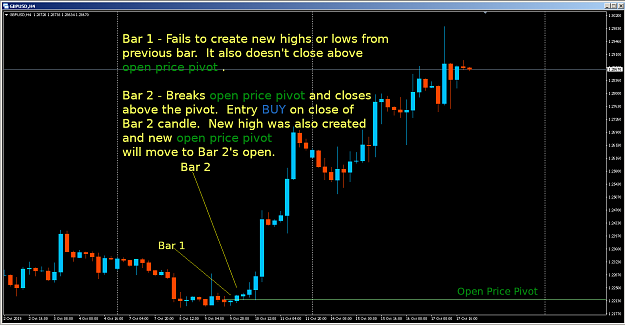
- Looking for Buy Setups (reverse when looking for sell setups):
- Price is above the Pivot & has an Engulfing candle
or
- Candle opens below Pivot, and closes above Pivot with an engulfing pattern.
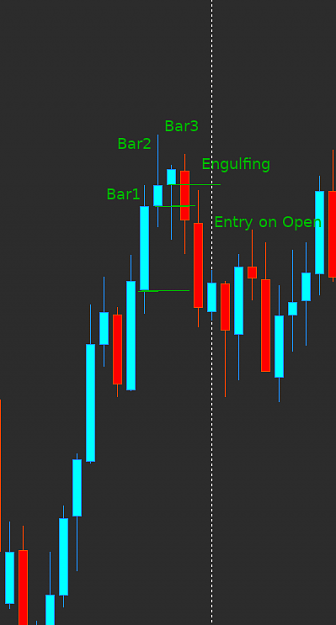
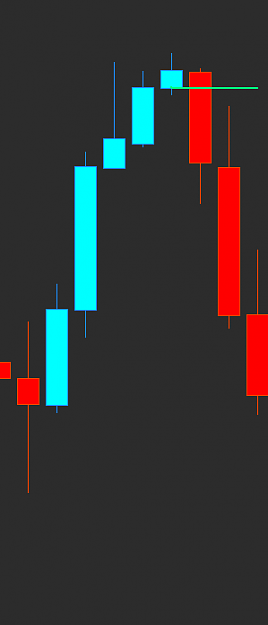
Attachment g
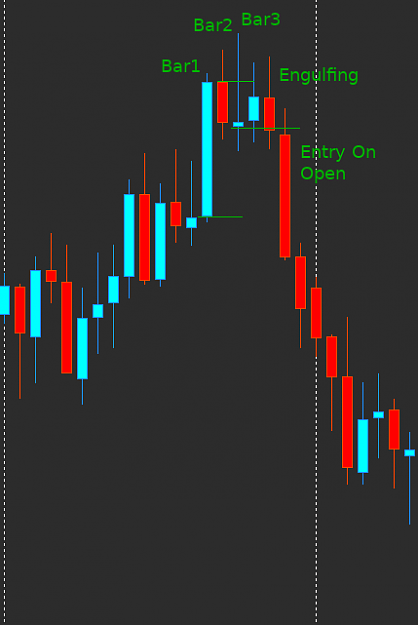
Example of a sell setup, Bar1 opens above Open Price Pivot and closes below the pivot, and engulfs the previous candle. Also it doesn’t matter how many previous candles it engulfs as well.
Sell on the open of Bar2
Stop loss is the size of Bar1
Take Profit is the size of Bar1
Just like any system, I always look at the bigger timeframes to get an overall direction of the market before making any decisions. Ie. If trend is up I avoid looking to sell, vice versa.
EDIT: Added some more examples below.
There are 2 options I use to trade.
1) Entries for BUY/SELL condition & adjusting the Open Price Pivot on one time-frame chart (ie. either 4hr, Daily, shorter timeframe is O.K too, but i prefer longer time frame)
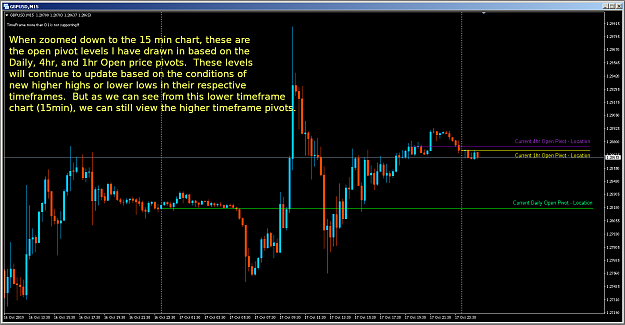
2) Entries for BUY/SELL on shorter timeframe but using the Open Price Pivot on a higher time-frame.
- 4hr entries / Daily Open Price Pivot
or
- 15min entries / 1hr Open Price Pivot