Hello all.
I am new to coding in MT4. I have done a TON of coding in NinjaTrader 7, which is done using C#.
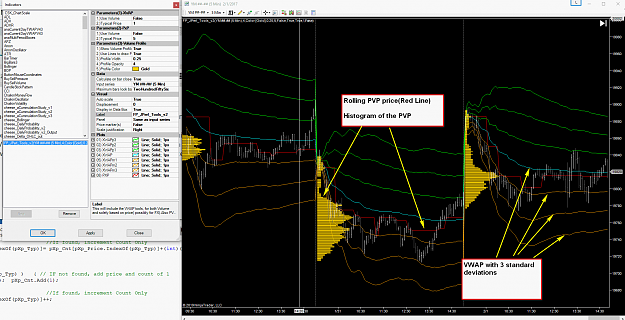
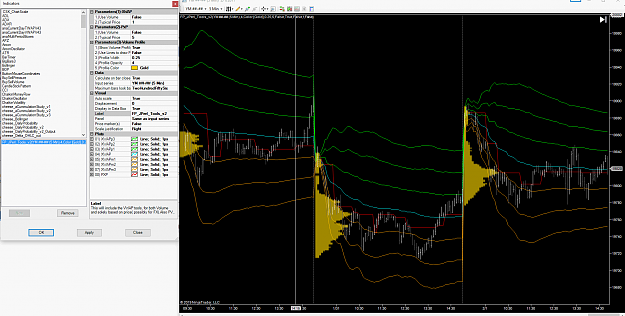
I have an indicator I created a long time ago in NT7 that I want to rebuild in MT4. This indicator is a VWAP(Volume-Weighted-Average-Price), combined with a PVP(Peak-Volume-Price) indicator. The PVP also has a histogram associated with it.
My original indicator did the standard calculations using VOLUME like you would expect, for both the PVP and the VWAP. But I also created a PWAP(Price-Weighted-Average-Price) and a PVP that uses price instead of volume. They actually look EXTREMELY similar. I will be recreating the Price version of this indie for use in FX.
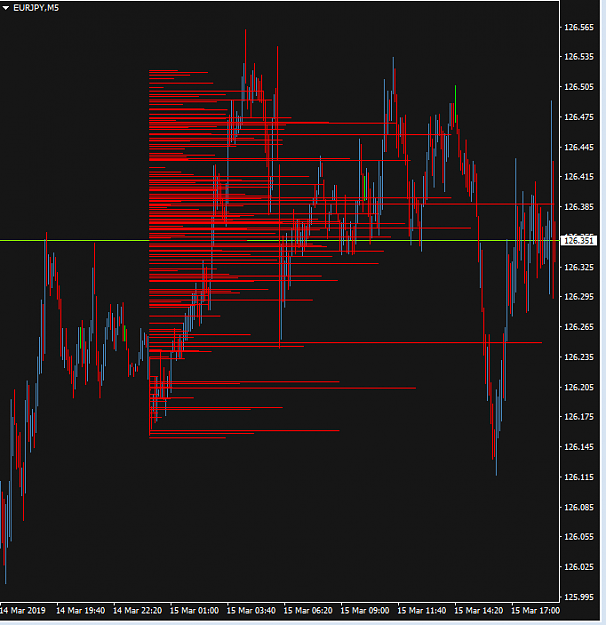
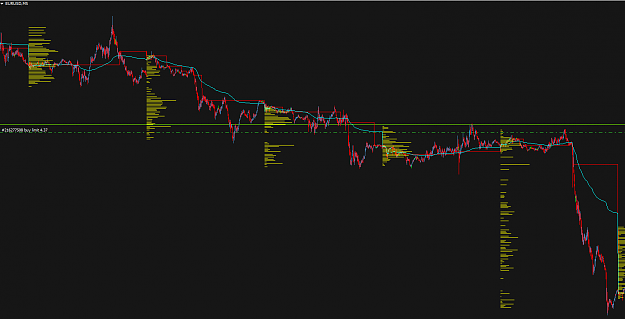
If for any reason someone uses NT7 and wants to DL it, you can find it HERE. Attached below are images of the indicator... I have allowed two different ways to produce the histogram, one of which draws it with horizontal lines, the other draws it with rectangles, so drawing is something I will need to do.
I don't expect any single person to answer every question, but if you know how to accomplish one of these things, it would be appreciated.
So here are my questions on things I need to do:
- NT7 has a particular structure, where you can perform a calculation each time a bar ends... I.e., OnBarUpdate() {...}. So everything inside this function, will calculate as the bar closes. Is there a way to do this in MT4? I only want the indie to be calculated obviously when I put it on a chart, and then once on bar close. In MT4, is it as simple as wrapping it in some function?
- I will be creating this indicator for Daily, Weekly and Monthly. In NT7, there are ways to delineate the start of a Day, Week and Month. I.e., at the start of a Day(if(Bars.FirstBarOfSession) {...}). This would allow me to do something at the close of the first bar that represents the start of the day. I will want to do this for the start of the week and month also... when that FIRST bar closes so I can start collecting stats.
- Is there a similar easy way to detect the last bar of a given period? Similar to End of a day, week or month?
- I will need to draw both a histogram, and a line(seen in attached images). What's the best way to accomplish this?
- I used lists in NinjaTrader, which is just like an array, where I can store many items in it. I used this to store the values for my histogram. Does MT4 have something similar to an array that I can use?
I will need some other things, but I think the above should at least get me started.
Thanks!!!


