Hello all,
First of all many thanks to Mouteki trader for sharing such system
I was reading the method but I think I am totally confused,
I have following questions:
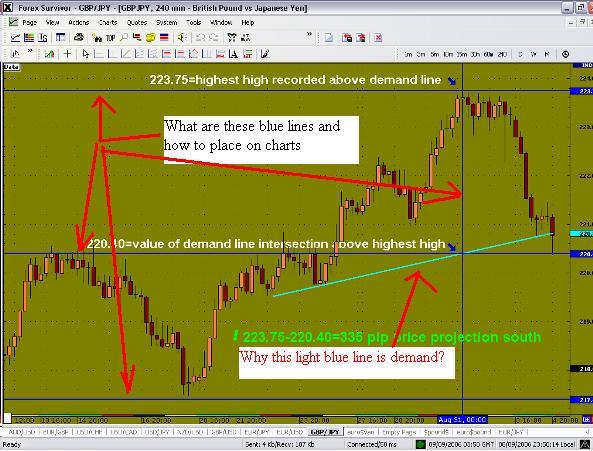
1. How do you determine supply/demand curves? is it simply trendlines?
2. What is projection? is it fib projection? how to apply correctly?
3. I see blue lines, what do these lines indicate
see also attached image
thanks
First of all many thanks to Mouteki trader for sharing such system
I was reading the method but I think I am totally confused,
I have following questions:
1. How do you determine supply/demand curves? is it simply trendlines?
2. What is projection? is it fib projection? how to apply correctly?
3. I see blue lines, what do these lines indicate
see also attached image
thanks
Attached Image