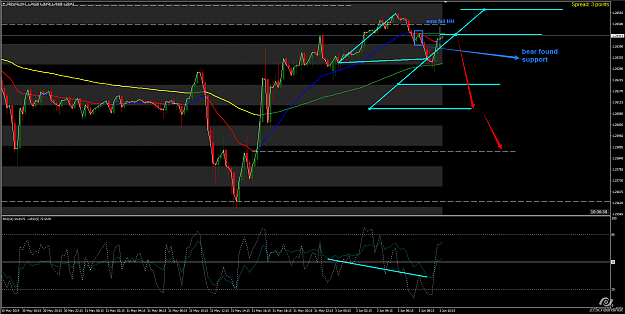
I was wondering about m15 cause it fails to make new swing average high , broke the ema and bear found support... so is it not a signal for price to get to nex level wich is 1.2587 ??
{quote} I was wondering about m15 cause it fails to make new swing average high , broke the ema and bear found support... so is it not a signal for price to get to nex level wich is 1.2587 ?? {image}
Ignored
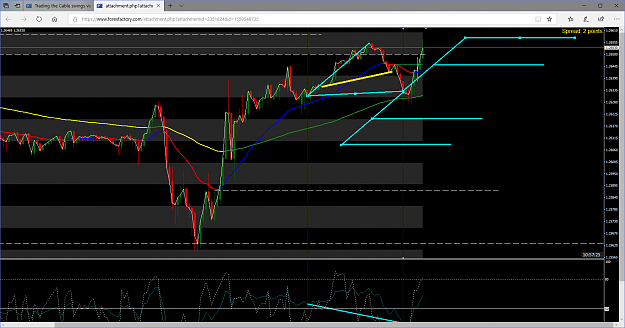
So if it found bear support the swing failure was the LL
{quote} I was wondering about m15 cause it fails to make new swing average high , broke the ema and bear found support... so is it not a signal for price to get to nex level wich is 1.2587 ?? {image}
Ignored
The ABCD you have here is not even close to being drawn correctly
{quote} So if it found bear support the swing failure was the LL
Ignored
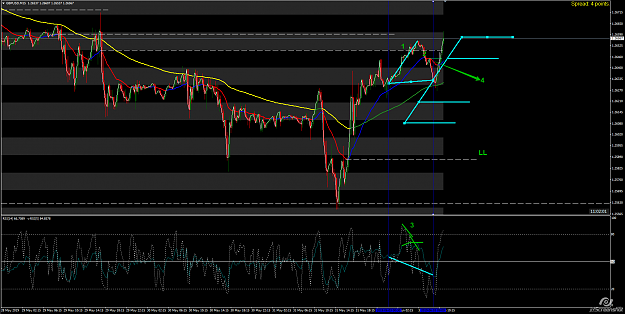
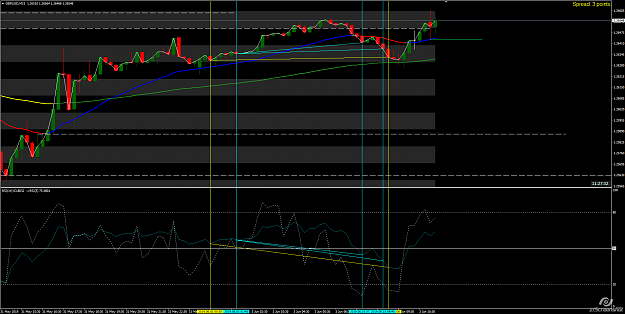
Here i am a bit lost...
Im gonna share me view and please correct me where i am wrong.
Price was going UP while EMA was also same direction.
1. price make the HH
2. EMA Fails to do it.
3.RSI div at that point took the price back to EMA
4.Bear found support, so they will attemp new LL ??
{quote} Here i am a bit lost... Im gonna share me view and please correct me where i am wrong. Price was going UP while EMA was also same direction. 1. price make the HH 2. EMA Fails to do it. 3.RSI div at that point took the price back to EMA 4.Bear found support, so they will attemp new LL ?? Thnks {image}
Ignored
This is correct but they failed in their attempt. We look for failures
{quote} You are correct it is drawn incorrectly {image}
Ignored
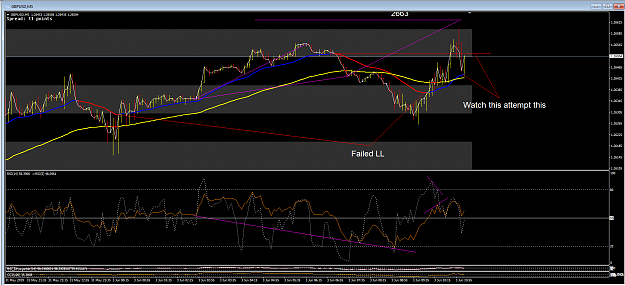
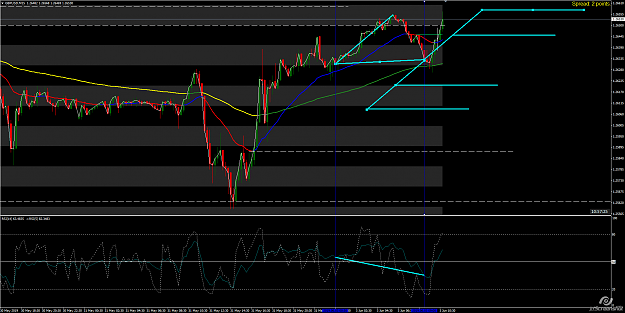
Ok and last question for the day to not overload u...
First two aqua ABCD would be correct and the yellow one is it incorrect?
And is it beacuse we take just the the first B when the divergence surge, then once C goes lower than B we dont pick another lower B and just wait for the already ABCD formed patterns to complete?
{quote} Ok and last question for the day to not overload u... First two aqua ABCD would be correct and the yellow one is it incorrect? And is it beacuse we take just the the first B when the divergence surge, then once C goes lower than B we dont pick another lower B and just wait for the already ABCD formed patterns to complete? {image}