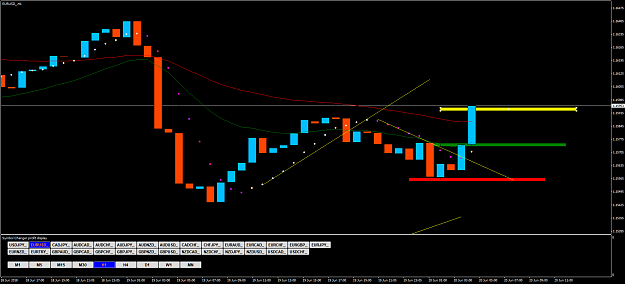
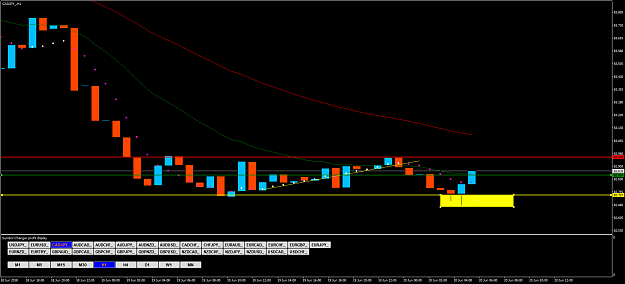
Hi im looking at an idea for a system using the nonlagdot and trednline breaks.
Basically we plot the trendline over the dots of the nonlagdot indicator as the dots progress, if there is an opposite color dot that forms and the price closes below the trendline we will take a trade only if its in the direction of the 50 and 20 emas.
For buys the 20 ema has to be on top of 50 ema and vice versa for sells.
note: we have to plot the trendline from right to left.
For example for an uptrendline. We start with the latest dot and second point of trendline we will place on the lowest dot.
In the below pic you would go long but this is against what I just said about following the emas thus it would have been a countertrend trade.
This is another option to go countertrend. Maybe we can take countertrend trades with 1:1 rr. and trend with 1:2 rr.
I need to know if anyone can create an indicator with alerts based on this system.


